Agency: State Treasurer Line Item: State Treasurer Function The State Treasurer budget consists of only one line item. The line item has four programs: Treasury and Investment, Unclaimed Property, Money Management Council, and Financial Assistance.
Intent Language Under section 63J-1-603 of the Utah Code, the Legislature intends that appropriations provided for the State Treasurer in Item 7 of Chapter 2 Laws of Utah 2010 not lapse at the close of Fiscal Year 2011. The Legislature intends that agencies maximize budgets by examining expiring leases and contracts and explore all possibilities in doing so including re-negotiating for lower lease and contract rates, planning and allowing leases to expire and moving to locations with lower costs, purchasing instead of leasing a facility, and more. Funding Detail | Sources of Finance | 2008
Actual | 2009
Actual | 2010
Actual | 2011
Actual | 2012
Approp | | General Fund | $1,010,900 | $938,400 | $875,300 | $940,200 | $870,500 | | General Fund, One-time | $0 | $14,300 | $91,100 | $0 | $0 | | Dedicated Credits Revenue | $271,300 | $364,600 | $363,300 | $445,900 | $527,400 | | Unclaimed Property Trust | $1,365,700 | $1,465,300 | $1,399,500 | $1,412,300 | $1,408,100 | | Beginning Nonlapsing | $466,700 | $520,000 | $475,000 | $445,000 | $0 | | Closing Nonlapsing | ($520,000) | ($475,000) | ($445,000) | ($250,000) | $0 | | Lapsing Balance | ($244,800) | ($301,200) | ($396,100) | ($216,800) | $0 | | Total | $2,349,800 | $2,526,400 | $2,363,100 | $2,776,600 | $2,806,000 |
|---|
| | Programs: | 2008
Actual | 2009
Actual | 2010
Actual | 2011
Actual | 2012
Approp | | Treasury and Investment | $1,135,300 | $1,246,000 | $1,103,400 | $1,127,000 | $1,235,200 | | Unclaimed Property | $1,150,100 | $1,203,000 | $1,180,000 | $1,568,900 | $1,408,100 | | Money Management Council | $64,400 | $77,400 | $79,700 | $80,700 | $85,600 | | Financial Assistance | $0 | $0 | $0 | $0 | $77,100 | | Total | $2,349,800 | $2,526,400 | $2,363,100 | $2,776,600 | $2,806,000 |
|---|
| | Categories of Expenditure | 2008
Actual | 2009
Actual | 2010
Actual | 2011
Actual | 2012
Approp | | Personnel Services | $1,709,400 | $1,841,700 | $1,802,700 | $1,840,500 | $1,999,000 | | In-state Travel | $2,600 | $1,300 | $1,600 | $1,000 | $4,000 | | Out-of-state Travel | $13,800 | $11,200 | $1,600 | $13,600 | $8,200 | | Current Expense | $533,100 | $566,200 | $481,100 | $519,600 | $569,100 | | DP Current Expense | $82,300 | $106,000 | $76,100 | $134,900 | $108,500 | | DP Capital Outlay | $8,600 | $0 | $0 | $9,000 | $117,200 | | Capital Outlay | $0 | $0 | $0 | $22,000 | $0 | | Other Charges/Pass Thru | $0 | $0 | $0 | $236,000 | $0 | | Total | $2,349,800 | $2,526,400 | $2,363,100 | $2,776,600 | $2,806,000 |
|---|
| | Other Indicators | 2008
Actual | 2009
Actual | 2010
Actual | 2011
Actual | 2012
Approp | | Budgeted FTE | 27.3 | 27.3 | 25.5 | 25.0 | 25.5 | | Actual FTE | 19.6 | 20.7 | 20.9 | 21.0 | 0.0 | | Vehicles | 1 | 1 | 1 | 1 | 1 |
|
|
|
|
|
|
Subcommittee Table of ContentsProgram: Treasury and Investment Function This program adheres to the Money Management Act and Rules of the Money Management Council, and uses appropriate investment research tools to maximize the safety of state and local government funds invested and to earn competitive yields. The Treasurer also maintains the Public Treasurers' Investment Fund (PTIF) so that other governmental entities can pool their idle money together for professional management, a high degree of liquidity and optimal return on funds. All available funds are invested each day at competitive interest rates. The primary investment instruments used are bank certificates of deposit, commercial paper, short-term corporate notes, and obligations of the U. S. Treasury and government agencies. The Treasurer is a member of the State Bonding Commission and the State Building Ownership Authority, which issues debt for the state. He oversees the team of professionals who work together to issue debt including the financial advisor, bond counsel, disclosure counsel and underwriters. He coordinates all relations with bond rating agencies including formal presentations at least once a year. The Treasurer also manages the investments of the State School and Institutional Trust Funds. The dividend and interest earnings from the State School Fund provide income for the Permanent School Fund, which allocates funding directly to individual schools statewide. Performance The following chart shows historical interest rates earned by the PTIF. Rates have been less than one percent since June of 2009. A review of records back to 1981 shows this is the first time interest rates have fallen below one percent in that time frame. Returns are directly correlated to the relative level of short-term interest rates.
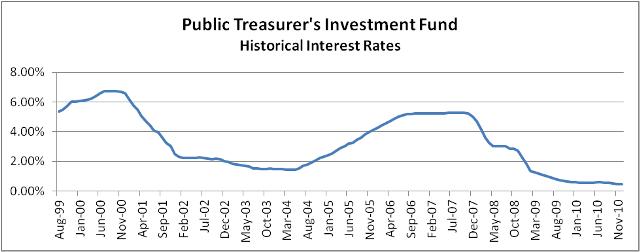 - FY 2011 Spread between PTIF interest rate and benchmark interest rate: 0.33%
The chart below depicts historical dividend and interest income to the Permanent School Fund by fiscal year. 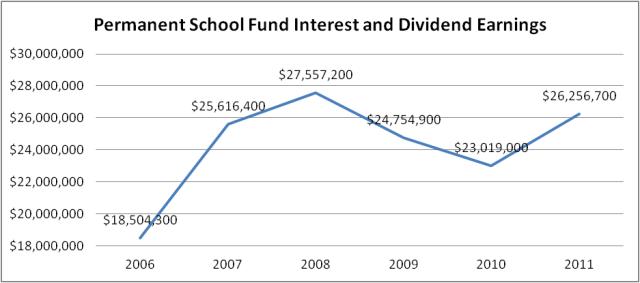 The State School and Institutional Trust Fund portfolios hold a broadly diversified mix of investments, including domestic equities, domestic fixed income, international equities and real estate. Given the substantial breadth of underlying investments held within the portfolio, the factors which impact the investments are numerous, but in simplest terms, the investments are impacted primarily by global economic conditions and the financial performance of the underlying diversified investments (stocks and bonds, primarily) that are maintained within the portfolio. Interest and dividend earnings increased from FY 2010 to FY 2011 for three primary reasons: - Dividend yields on common stocks are beginning to rebound after having retracted in 2008 and 2009.
- Investments in higher-yielding real estate assets have increased steadily over the past three fiscal years.
- The portfolio's corpus grew significantly over the past year due to a 22% increase in market value of the investments, and also related to ongoing annual contributions into the fund (which exceeded $68 million for FY11) from the state's School and Institutional Trust Lands Administration (SITLA).
Funding Detail | Sources of Finance | 2008
Actual | 2009
Actual | 2010
Actual | 2011
Actual | 2012
Approp | | General Fund | $911,700 | $858,400 | $789,900 | $853,800 | $784,900 | | General Fund, One-time | $0 | $8,900 | $91,600 | $0 | $0 | | Dedicated Credits Revenue | $271,300 | $364,600 | $363,300 | $445,900 | $450,300 | | Unclaimed Property Trust | $0 | $61,500 | $0 | $0 | $0 | | Beginning Nonlapsing | $130,000 | $145,000 | $100,000 | $50,000 | $0 | | Closing Nonlapsing | ($145,000) | ($100,000) | ($50,000) | ($50,000) | $0 | | Lapsing Balance | ($32,700) | ($92,400) | ($191,400) | ($172,700) | $0 | | Total | $1,135,300 | $1,246,000 | $1,103,400 | $1,127,000 | $1,235,200 |
|---|
| | Categories of Expenditure | 2008
Actual | 2009
Actual | 2010
Actual | 2011
Actual | 2012
Approp | | Personnel Services | $957,000 | $979,100 | $922,900 | $911,500 | $914,700 | | In-state Travel | $1,800 | $500 | $900 | $600 | $2,200 | | Out-of-state Travel | $10,300 | $8,200 | $1,600 | $8,800 | $8,200 | | Current Expense | $137,500 | $227,400 | $162,900 | $188,600 | $176,400 | | DP Current Expense | $20,100 | $30,800 | $15,100 | $17,500 | $16,500 | | DP Capital Outlay | $8,600 | $0 | $0 | $0 | $117,200 | | Total | $1,135,300 | $1,246,000 | $1,103,400 | $1,127,000 | $1,235,200 |
|---|
| | Other Indicators | 2008
Actual | 2009
Actual | 2010
Actual | 2011
Actual | 2012
Approp | | Budgeted FTE | 9.5 | 9.5 | 9.5 | 8.8 | 9.3 | | Actual FTE | 7.9 | 7.8 | 7.5 | 7.3 | 0.0 | | Vehicles | 1 | 1 | 1 | 1 | 1 |
|
|
|
|
|
|
Subcommittee Table of ContentsProgram: Unclaimed Property Function The Unclaimed Property Program is responsible for reuniting lost or abandoned property with its rightful owners. Property types include savings accounts, life insurance policies, payroll checks, safe deposit box contents, stocks and mutual funds, and other types of property. Any amount not returned to rightful owners is deposited in the Uniform School Fund. Each year the Division is required, under UCA 67-4a-402, to publish notice of property received during the year in a newspaper having general circulation in Utah. Additional outreach programs include billboard ads, radio ads, locating services which enable owners to search for their names in the database, and listing all names and addresses on mine.utah.gov and missingmoney.com. Several employees are actively involved in locating efforts. The Unclaimed Property Division maximizes returns of abandoned property to owners through examining current business processes and implementing imporvements where needed. In addition, the Division continues to increase productivity through the adoption of new IT enabled processes such as document imaging. Statutory Authority Statutory authority is provided within UCA 67-4a, "Unclaimed Property Act." Performance - FY 2011 Number of unclaimed property claims paid: 7,433
- FY 2011 Dollar amount of unclaimed property claims paid: $8,641,451
- FY 2011 Transfer from the Unclaimed Property Trust Fund to the Uniform School Fund: $25,000,000
Funding Detail The program's administrative costs are paid from the Unclaimed Property Trust Fund. As allowed in UCA 67-4a-405, the fund receives proceeds from the sale of abandoned property. | Sources of Finance | 2008
Actual | 2009
Actual | 2010
Actual | 2011
Actual | 2012
Approp | | Unclaimed Property Trust | $1,365,700 | $1,403,800 | $1,399,500 | $1,412,300 | $1,408,100 | | Beginning Nonlapsing | $331,700 | $375,000 | $375,000 | $395,000 | $0 | | Closing Nonlapsing | ($375,000) | ($375,000) | ($395,000) | ($200,000) | $0 | | Lapsing Balance | ($172,300) | ($200,800) | ($199,500) | ($38,400) | $0 | | Total | $1,150,100 | $1,203,000 | $1,180,000 | $1,568,900 | $1,408,100 |
|---|
| | Categories of Expenditure | 2008
Actual | 2009
Actual | 2010
Actual | 2011
Actual | 2012
Approp | | Personnel Services | $693,000 | $791,900 | $809,700 | $858,100 | $935,800 | | In-state Travel | $800 | $800 | $700 | $400 | $1,800 | | Out-of-state Travel | $3,500 | $3,000 | $0 | $4,800 | $0 | | Current Expense | $390,600 | $332,300 | $308,600 | $321,200 | $378,500 | | DP Current Expense | $62,200 | $75,000 | $61,000 | $117,400 | $92,000 | | DP Capital Outlay | $0 | $0 | $0 | $9,000 | $0 | | Capital Outlay | $0 | $0 | $0 | $22,000 | $0 | | Other Charges/Pass Thru | $0 | $0 | $0 | $236,000 | $0 | | Total | $1,150,100 | $1,203,000 | $1,180,000 | $1,568,900 | $1,408,100 |
|---|
| | Other Indicators | 2008
Actual | 2009
Actual | 2010
Actual | 2011
Actual | 2012
Approp | | Budgeted FTE | 15.8 | 15.8 | 14.0 | 14.2 | 14.3 | | Actual FTE | 10.9 | 12.0 | 12.5 | 12.8 | 0.0 |
|
|
|
|
|
|
Subcommittee Table of ContentsProgram: Money Management Council Function The Utah Money Management Council is responsible for the oversight of bank deposits and investments maintained by all Utah public treasurers. This involves overseeing and supporting over 500 public treasurers from municipalities of all types; large and small, urban and rural. Additionally, the council must oversee and monitor the degree to which, over 60 financial institutions which hold public funds, comply with the Money Management Act and Rules of the Money Management Council. The State Treasurer's Office provides staff to the council, and the Treasurer serves as the Council's executive secretary without voting rights. The council is comprised of five members appointed by the Governor with the advice and consent of the Senate. At least one member must be from banking, one must be an elected treasurer, one must be an appointed treasurer and one must be experienced in the field of investments. No more than three members of the council may be from the same political party. Statutory Authority Statutory authority for this program is provided within UCA 51 Chapter 7, "Money Management Act." Funding Detail | Sources of Finance | 2008
Actual | 2009
Actual | 2010
Actual | 2011
Actual | 2012
Approp | | General Fund | $99,200 | $80,000 | $85,400 | $86,400 | $85,600 | | General Fund, One-time | $0 | $5,400 | ($500) | $0 | $0 | | Beginning Nonlapsing | $5,000 | $0 | $0 | $0 | $0 | | Lapsing Balance | ($39,800) | ($8,000) | ($5,200) | ($5,700) | $0 | | Total | $64,400 | $77,400 | $79,700 | $80,700 | $85,600 |
|---|
| | Categories of Expenditure | 2008
Actual | 2009
Actual | 2010
Actual | 2011
Actual | 2012
Approp | | Personnel Services | $59,400 | $70,700 | $70,100 | $70,900 | $76,300 | | Current Expense | $5,000 | $6,500 | $9,600 | $9,800 | $9,300 | | DP Current Expense | $0 | $200 | $0 | $0 | $0 | | Total | $64,400 | $77,400 | $79,700 | $80,700 | $85,600 |
|---|
| | Other Indicators | 2008
Actual | 2009
Actual | 2010
Actual | 2011
Actual | 2012
Approp | | Budgeted FTE | 1.0 | 1.0 | 1.0 | 1.0 | 1.0 | | Actual FTE | 0.8 | 0.9 | 0.9 | 0.9 | 0.0 |
|
|
|
|
|
|
Subcommittee Table of ContentsProgram: Financial Assistance Function Although this program received an appropriation from dedicated credits for FY 2012, it is not currently in use by the Treasurer. When operational, the program evaluates proposals for water and other infrastructure development submitted to the Community Impact Board, the Board of Water Resources, the Water Pollution Control Committee and the Safe Drinking Water Committee. It prioritizes and makes standardized responses. The FTE is funded by the boards which utilize its service. Funding Detail | Sources of Finance | 2008
Actual | 2009
Actual | 2010
Actual | 2011
Actual | 2012
Approp | | Dedicated Credits Revenue | $0 | $0 | $0 | $0 | $77,100 | | Total | $0 | $0 | $0 | $0 | $77,100 |
|---|
| | Categories of Expenditure | 2008
Actual | 2009
Actual | 2010
Actual | 2011
Actual | 2012
Approp | | Personnel Services | $0 | $0 | $0 | $0 | $72,200 | | Current Expense | $0 | $0 | $0 | $0 | $4,900 | | Total | $0 | $0 | $0 | $0 | $77,100 |
|---|
| | Other Indicators | 2008
Actual | 2009
Actual | 2010
Actual | 2011
Actual | 2012
Approp | | Budgeted FTE | 1.0 | 1.0 | 1.0 | 1.0 | 1.0 |
|
|
|
|
|
|
Subcommittee Table of Contents |