Compendium of Budget Information for the 2012 General Session
| Executive Offices & Criminal Justice Appropriations Subcommittee | |||||||||||||||||||||||||||||||||||||||||||||||||||||||||||||||||||||||||||||||||||||||||||||||||||||||||||||||||||||||||||||||||||||||||||||||||||||||||||||||||||||||||||||||||||||||
| Subcommittee Table of Contents | |||||||||||||||||||||||||||||||||||||||||||||||||||||||||||||||||||||||||||||||||||||||||||||||||||||||||||||||||||||||||||||||||||||||||||||||||||||||||||||||||||||||||||||||||||||||
Function The Highway Safety line item has only one program�the Highway Safety program. The Utah Highway Safety program has the responsibility of proposing, negotiating and managing the state's contract with National Highway Traffic Safety Administration for federal funds to be expended on highway safety projects within the state. The Utah Highway Safety program acts to subcontract with state, local, and private organizations in Utah to expend resources to implement highway safety activities. The activities associated with the subcontracting process are project development, technical assistance, consultation, liaison, evaluation, reporting, accounting, data collection, problem identification, resource analysis, project monitoring, and subcontract negotiations. The program also contracts for special projects, negotiates with subcontractors for expenditure of these funds, and manages the implementation and progress of these projects. The Utah Highway Safety program coordinates the highway safety efforts within the state and maintains communications with all involved agencies and individuals. These include entities such as the Board of Education, Department of Transportation, Health Department, State Planning Office, State Court Administrator, Department of Public Safety, local police departments and sheriffs, the National Safety Council, PTA, and news media. Since the Utah Highway Safety program is a state agency, it responds to requests for information from other agencies and from private citizens. Statutory Authority Statutory Authority for Highway Safety is found in UCA 41-19. Intent Language
Performance The primary objective of the Utah Highway Safety program is to "to develop, promote and coordinate traffic safety initiatives designed to reduce traffic crashes, injuries and fatalities on Utah's roadways." Included below are metrics that indicate relevant outicomes related to this purpose. Measures inlcude observed seatbelt usage, motor vehicle crash fatalities, and off-premise retailer compliance rate. Observed seatbelt usage was highest in 2010 from 2001 to 2010. The number of fatalities has decreased but up in Q2. The off-premise retailer compliance rate increased since 2009. 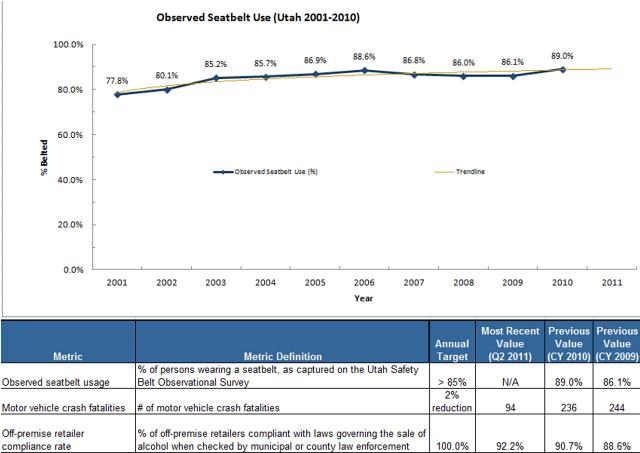 Special Funds 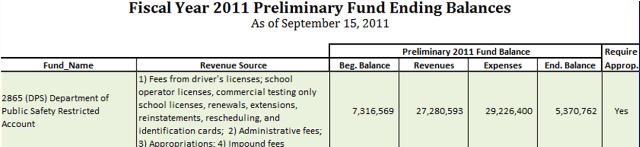 Funding Detail
|