Agency: State Board of Education Line Item: State Office of Education Function The Utah State Office of Education (USOE) functions as support staff to the State Board of Education and the State Superintendent of Public Instruction. The USOE provides information relating to public education policy, procedure and program implementation. Staff at USOE provides statewide service, support, and direction to local school districts and charter schools.
The State Board of Education appoints a State Superintendent of Public Instruction to act as the executive officer of the Board. The Superintendent administers all programs assigned to the State Board of Education. Specifically, the Superintendent acts as a liaison with the Legislature and state and federal agencies, coordinates functions between the State Board of Education and the State Charter School Board, works with higher education on various education issues, and, following Legislative appropriations, provides authorized direction for policy and budget matters. In addition to the State Board of Education and the State Superintendent, the state office of education houses several operating sections whose work represents the costs associated with the state administration of public education:
- Board and Administration;
- Assessment and Accountability;
- Career and Technical Education;
- District Computer Services;
- Federal Elementary and Secondary Education Act;
During the 2012 General Session, the Legislature increased the number of appropriation units from 4 to 13 as a way to increase understanding and transparency.
Prior to FY 2009, the State Office of Education operated two internal service funds (ISFs)--State Board of Education ISF and Superintendent Indirect Cost Pool--that were used to support USOE's internal operations. The Indirect Cost Pool is still in operation, however, the State Board ISF, mainly used for print and mail services by the Board, was dissolved as part of streamlining state print and mail operations.Statutory Authority The State office of Education (USOE) does not have statutory language creating the office. However, state level administration of the public education system is detailed throughout statute, with certain statutes refering to the USOE, requiring reports from USOE, specifically directing USOE functions, or providing for USOE administration of certain education programs. The state level education administration statutes are in UCA Title 53A, Chapter 1. Each subsequent Statutory Authority section in this chapter provides highlights of major statutes detailing office functions or specific programs within USOE sections. The appointment, duties, and responsibilities of the State Superintendent can be found in the following statutes: - UCA 53A-1-301 -- Provides guidelines for the appointment of the State Superintendent of Public Instruction and outlines the qualifications and duties of the Superintendent.
- UCA 53A-1-303 -- Directs the State Superintendent to give advice and provide opinions to local school boards, superintendents, and other school officers on public education matters.
Intent Language The Legislature intends that the State Board of Education address the costs and benefits of its Early Retirement Incentive Pay Plan and its open Other Post Employment Benefits plan that allows individuals to accumulate health insurance benefits at retirement. The State Board should report its findings to the Public Education Appropriations Subcommittee by November 2012. The Legislature intends that the Utah State Office of Education work with the legislative fiscal analyst for public education in developing job specific outcome based performance measures and report these measures to the Public Education Appropriations Subcommittee by December 2012. The Legislature intends that the Utah State Office of Education work with the legislative fiscal analyst for public education in performing cost-benefit analysis on activities of the programs within the Utah State Office of Education - Administration line item and report the results to the Public Education Appropriations Subcommittee before November 2012. The Legislature intends that the Department of Health, the Utah State Office of Rehabilitation, and the Utah State Office of Education (Special Education) use funds previously transferred to support the Utah Developmental Disability Council (UDDC) information and referral phone/website to instead provide direct client services to individuals with disabilities. The Legislature further intends the UDDC, as a federally-established and federallly-governed agency, use its federal funds to support its information and referral phone/website. The Legislature intends the Department of Health, the Utah State Office of Rehabilitation, and the Utah State Office of Education (Special Education) use funds previously transferred to support the Access Utah program to instead contract with a private human services directory database entity to provide a free information and referral service statewide for individuals with disabilities. Special Funds The State Office of Education receives revenue from four restricted sources.
- Funds received from the General Fund--Substance Abuse Prevention account support substance abuse prevention and education programs in the schools.
- The Uniform School Fund--Professional Practices restricted revenue supports the processing of teacher licenses and the Utah Professional Practices Advisory Commission (now done in the Educator Licensing line-item).
- The Uniform School Fund�Interest and Dividends revenue comes from the investment of monies in the permanent State School Fund and any interest on account monies. Funds from this account are used at USOE to administer the School LAND Trust Program. The majority of funds from this account are distributed to school districts and charter schools through the Minimum School Program.
- The General Fund Restricted�Land Exchange Distribution Account was created by House Bill 134 from the 2007 General Session. According to statute, monies are set aside for "education research and experimentation in the use of staff and facilities designed to improve the quality of education in Utah."
Funding Detail Of the total revenue in FY 2012 of $338 million, approximately 9% funded USOE operations and the remaining 91% was passed on to local school districts, charter schools, or other education entities. The USOE acts as the fiscal agent for most federal programs and grants administered by the U.S. Department of Education. The federal funding of certain education programs at the local level flows through the USOE. Federal funds made up about 91 percent of the USOE budget in FY 2012. Sources of Finance
(click linked fund name for more info) | 2009
Actual | 2010
Actual | 2011
Actual | 2012
Actual | 2013
Approp | | General Fund | $2,312,500 | $0 | $0 | $0 | $0 | | General Fund, One-time | $1,090,600 | $0 | $0 | $0 | $20,000 | | Uniform School Fund | $27,022,600 | $21,089,300 | $0 | $0 | $0 | | Uniform School Fund, One-time | $3,537,700 | ($434,900) | $0 | $0 | $0 | | Education Fund | $0 | $0 | $21,103,300 | $20,696,600 | $28,147,000 | | Education Fund, One-time | $0 | $0 | $7,700 | $818,200 | $1,000,000 | | Federal Funds | $236,618,800 | $224,833,400 | $339,867,100 | $307,235,500 | $339,995,200 | | American Recovery and Reinvestment Act | $3,088,800 | $31,580,700 | $0 | $0 | $0 | | Dedicated Credits Revenue | $5,394,500 | $5,896,200 | $5,384,400 | $5,438,500 | $5,907,300 | | Federal Mineral Lease | $3,735,900 | $2,804,000 | $3,034,800 | $3,358,600 | $3,064,200 | | GFR - Land Exchange Distribution Account | $302,400 | $292,700 | $302,400 | $302,400 | $222,500 | | GFR - Substance Abuse Prevention | $494,500 | $490,600 | $497,200 | $497,000 | $497,000 | | Interest and Dividends Account | $409,700 | $409,200 | $410,400 | $409,400 | $536,000 | | Transfers | $3,919,900 | $0 | $917,600 | $0 | $685,800 | | Transfers - Interagency | $0 | $1,454,800 | $0 | $1,110,900 | $0 | | Beginning Nonlapsing | $14,804,300 | $14,243,600 | $12,360,800 | $10,635,800 | $3,573,100 | | Closing Nonlapsing | ($14,277,600) | ($12,360,800) | ($10,635,800) | ($11,008,100) | ($3,573,100) | | Lapsing Balance | ($29,200) | $0 | ($50,500) | ($1,691,800) | $0 | | Total | $288,425,400 | $290,298,800 | $373,199,400 | $337,803,000 | $380,075,000 |
|---|
| | | | | | Programs:
(click linked program name to drill-down) | 2009
Actual | 2010
Actual | 2011
Actual | 2012
Actual | 2013
Approp |
|---|
| Assessment and Accountability | $0 | $0 | $0 | $0 | $21,111,800 | | Educational Equity | $0 | $0 | $0 | $0 | $365,400 | | Board and Administration | $0 | $0 | $0 | $0 | $6,241,500 | | Business Services | $0 | $0 | $0 | $0 | $1,698,800 | | Careeer and Technical Education | $0 | $0 | $0 | $0 | $22,878,700 | | District Computer Services | $0 | $0 | $0 | $0 | $5,259,400 | | Educational Technology | $0 | $0 | $0 | $0 | $3,485,700 | | Federal Elementary and Secondary Education Act | $0 | $0 | $0 | $0 | $125,365,100 | | Law and Legislation | $0 | $0 | $0 | $0 | $318,300 | | Public Relations | $0 | $0 | $0 | $0 | $131,700 | | School Trust | $0 | $0 | $0 | $0 | $536,000 | | Special Education | $0 | $0 | $0 | $0 | $162,045,900 | | Teaching and Learning | $0 | $0 | $0 | $0 | $30,636,700 | | Board of Education - Administration | $2,450,900 | $2,589,100 | $4,023,400 | $1,440,300 | $0 | | Student Achievement | $273,635,500 | $278,263,700 | $366,370,200 | $333,434,200 | $0 | | Data and Business Services | $1,282,600 | $1,089,800 | $1,416,600 | $1,547,000 | $0 | | Law, Legislation and Educational Services | $11,056,400 | $8,356,200 | $1,389,200 | $1,381,500 | $0 | | Total | $288,425,400 | $290,298,800 | $373,199,400 | $337,803,000 | $380,075,000 |
|---|
| | | | | | Categories of Expenditure
(mouse-over category name for definition) | 2009
Actual | 2010
Actual | 2011
Actual | 2012
Actual | 2013
Approp |
|---|
| Personnel Services | $18,965,900 | $17,642,200 | $17,558,100 | $17,098,800 | $17,757,200 | | In-state Travel | $188,400 | $231,600 | $238,200 | $192,900 | $238,100 | | Out-of-state Travel | $210,700 | $198,900 | $249,400 | $269,900 | $249,400 | | Current Expense | $27,163,200 | $19,492,100 | $16,001,100 | $12,340,900 | $24,219,000 | | DP Current Expense | $701,300 | $618,400 | $621,900 | $865,300 | $621,900 | | DP Capital Outlay | $161,600 | $633,400 | $1,818,600 | $950,800 | $1,501,700 | | Other Charges/Pass Thru | $241,034,300 | $251,482,200 | $336,712,100 | $306,084,400 | $335,487,700 | | Total | $288,425,400 | $290,298,800 | $373,199,400 | $337,803,000 | $380,075,000 |
|---|
| | | | | | | Other Indicators | 2009
Actual | 2010
Actual | 2011
Actual | 2012
Actual | 2013
Approp |
|---|
| Budgeted FTE | 213.7 | 220.0 | 217.0 | 205.0 | 200.7 | | Actual FTE | 214.1 | 204.4 | 199.1 | 194.0 | 0.0 | | Vehicles | 7 | 7 | 7 | 7 | 7 |
|
|
|
|
|
|
|---|
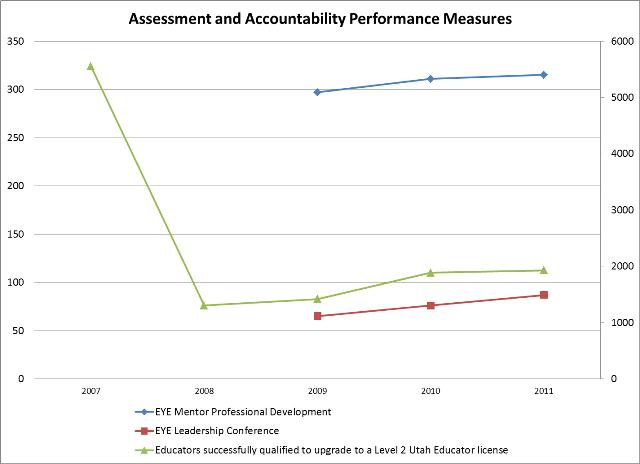
Subcommittee Table of ContentsProgram: Assessment and Accountability Function The Assessment and Accountability program represents the costs associated with researching educator evaluation methodology, providing consultative support to superintendents/charter directors on mentor development, providing professional development opportunities, developing assessment and accountability standards, conducting education conferences, and various other issues related to the needs of beginning to advanced teachers, mentoring, and licensing. Performance Among the measures the Assessment and Accountability program considers indicative of its success are Early Years Enhancement (EYE) Mentor Professional Development participants, EYE Leadership Conference participants, and educators successfully qualified to update to a Level 2 Utah Educator license.
 Funding Detail Sources of Finance
(click linked fund name for more info) | 2009
Actual | 2010
Actual | 2011
Actual | 2012
Actual | 2013
Approp | | Education Fund | $0 | $0 | $0 | $0 | $13,555,400 | | Education Fund, One-time | $0 | $0 | $0 | $0 | $1,000,000 | | Federal Funds | $0 | $0 | $0 | $0 | $6,326,600 | | Federal Mineral Lease | $0 | $0 | $0 | $0 | $229,800 | | Total | $0 | $0 | $0 | $0 | $21,111,800 |
|---|
| | | | | | Categories of Expenditure
(mouse-over category name for definition) | 2009
Actual | 2010
Actual | 2011
Actual | 2012
Actual | 2013
Approp |
|---|
| Personnel Services | $0 | $0 | $0 | $0 | $2,157,600 | | In-state Travel | $0 | $0 | $0 | $0 | $13,000 | | Out-of-state Travel | $0 | $0 | $0 | $0 | $28,000 | | Current Expense | $0 | $0 | $0 | $0 | $15,931,500 | | DP Current Expense | $0 | $0 | $0 | $0 | $18,300 | | Other Charges/Pass Thru | $0 | $0 | $0 | $0 | $2,963,400 | | Total | $0 | $0 | $0 | $0 | $21,111,800 |
|---|
Subcommittee Table of ContentsProgram: Educational Equity Function The Educational Equity program represents costs associated with race, national origin, sex, inter-scholastic sports, bullying, and life function complaints. The program responds to around 150 complaints or inquiries annually, with a cost per inquiry or complaint ranging from $500 to $5,000. Performance The Education Equity program considers timeliness of responding to complaints as indicative of its success. In FY 2012, the Program responded to all complaints within a three day window. Funding Detail Subcommittee Table of ContentsProgram: Board and Administration Function The Board and Administration program accounts for costs associated with the elected State Board, the Superintendent's Discretionary Account, and the Internal Audit program. Performance The State Board of Education considers CTE scores as indicative of its success.
 Funding Detail Sources of Finance
(click linked fund name for more info) | 2009
Actual | 2010
Actual | 2011
Actual | 2012
Actual | 2013
Approp | | Education Fund | $0 | $0 | $0 | $0 | $2,991,400 | | Dedicated Credits Revenue | $0 | $0 | $0 | $0 | $685,400 | | Federal Mineral Lease | $0 | $0 | $0 | $0 | $2,342,200 | | GFR - Land Exchange Distribution Account | $0 | $0 | $0 | $0 | $222,500 | | Beginning Nonlapsing | $0 | $0 | $0 | $0 | $3,573,100 | | Closing Nonlapsing | $0 | $0 | $0 | $0 | ($3,573,100) | | Total | $0 | $0 | $0 | $0 | $6,241,500 |
|---|
| | | | | | Categories of Expenditure
(mouse-over category name for definition) | 2009
Actual | 2010
Actual | 2011
Actual | 2012
Actual | 2013
Approp |
|---|
| Personnel Services | $0 | $0 | $0 | $0 | $717,000 | | In-state Travel | $0 | $0 | $0 | $0 | $52,500 | | Out-of-state Travel | $0 | $0 | $0 | $0 | $20,800 | | Current Expense | $0 | $0 | $0 | $0 | $2,260,500 | | DP Current Expense | $0 | $0 | $0 | $0 | $158,400 | | DP Capital Outlay | $0 | $0 | $0 | $0 | $122,900 | | Other Charges/Pass Thru | $0 | $0 | $0 | $0 | $2,909,400 | | Total | $0 | $0 | $0 | $0 | $6,241,500 |
|---|
Subcommittee Table of ContentsProgram: Business Services Function The Business Services program represents costs associated with tracking and reporting, allocating of MSP appropriations, gathering and analyzing statistical data such as educator information, local property tax, and pupil transportation, professional development, and technical assistance. Funding Detail Sources of Finance
(click linked fund name for more info) | 2009
Actual | 2010
Actual | 2011
Actual | 2012
Actual | 2013
Approp | | Education Fund | $0 | $0 | $0 | $0 | $1,690,400 | | Federal Funds | $0 | $0 | $0 | $0 | $8,400 | | Total | $0 | $0 | $0 | $0 | $1,698,800 |
|---|
| | | | | | Categories of Expenditure
(mouse-over category name for definition) | 2009
Actual | 2010
Actual | 2011
Actual | 2012
Actual | 2013
Approp |
|---|
| Personnel Services | $0 | $0 | $0 | $0 | $1,195,300 | | In-state Travel | $0 | $0 | $0 | $0 | $9,600 | | Out-of-state Travel | $0 | $0 | $0 | $0 | $8,400 | | Current Expense | $0 | $0 | $0 | $0 | $334,000 | | DP Current Expense | $0 | $0 | $0 | $0 | $1,200 | | Other Charges/Pass Thru | $0 | $0 | $0 | $0 | $150,300 | | Total | $0 | $0 | $0 | $0 | $1,698,800 |
|---|
Subcommittee Table of ContentsProgram: Careeer and Technical Education Function The Career and Technical Education program represents costs associated with teaching courses in certain areas:
- Agriculture Education: agriculture business and management, agricultural engineering, animal science, and horticulture;
- Business Education: accounting, administrative procedures/office support positions, banking and finance, business computer technology, communications, and web page design;
- Family and Consumer Sciences Education: child development/child care, food and nutrition, food services/culinary arts, hospitality, interior design, and fashion design;
- Health Science Education: biotechnology, dental assisting, emergency medical technician, medical assisting, nurse assisting, and pharmacy technician;
- Information Technology Education: database development, digital media, network design, programming and software engineering, technical support, and web development;
- Marketing Education: advertising and promotion, e-commerce marketing, fashion merchandising, sports and entertainment marketing, and travel and tourism;
- Skilled and Technical Sciences Education: a range of trades including auto mechanics, carpentry, commercial art and photography, commercial aviation, cosmetology, and barbering, drafting, fire science, law enforcement, and welding; and
- Technology and Engineering Education: materials, processes, and technologies used in manufacturing, construction, transportation, communication, and engineering-related technologies.
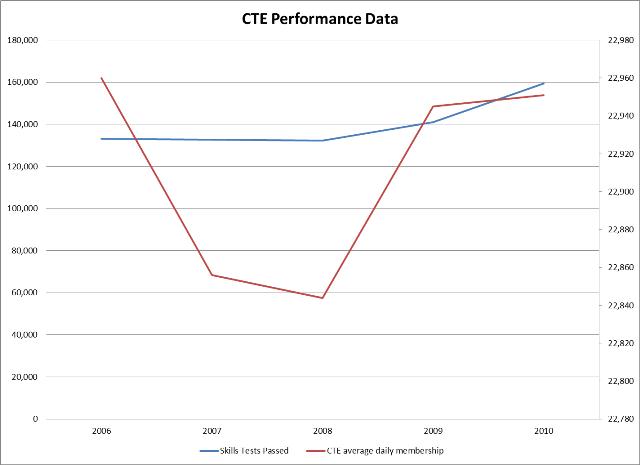
Performance The Career and Technical Education program considers Skills Tests Passed and CTE average daily membership as indicative of its success.
 Funding Detail Sources of Finance
(click linked fund name for more info) | 2009
Actual | 2010
Actual | 2011
Actual | 2012
Actual | 2013
Approp | | Education Fund | $0 | $0 | $0 | $0 | $1,891,700 | | Federal Funds | $0 | $0 | $0 | $0 | $19,855,800 | | Federal Mineral Lease | $0 | $0 | $0 | $0 | $225,900 | | GFR - Substance Abuse Prevention | $0 | $0 | $0 | $0 | $497,000 | | Transfers | $0 | $0 | $0 | $0 | $408,300 | | Total | $0 | $0 | $0 | $0 | $22,878,700 |
|---|
| | | | | | Categories of Expenditure
(mouse-over category name for definition) | 2009
Actual | 2010
Actual | 2011
Actual | 2012
Actual | 2013
Approp |
|---|
| Personnel Services | $0 | $0 | $0 | $0 | $3,164,000 | | In-state Travel | $0 | $0 | $0 | $0 | $56,600 | | Out-of-state Travel | $0 | $0 | $0 | $0 | $32,500 | | Current Expense | $0 | $0 | $0 | $0 | $1,025,000 | | DP Current Expense | $0 | $0 | $0 | $0 | $19,900 | | Other Charges/Pass Thru | $0 | $0 | $0 | $0 | $18,580,700 | | Total | $0 | $0 | $0 | $0 | $22,878,700 |
|---|
Subcommittee Table of ContentsProgram: District Computer Services Function The District Computer Services program represents costs associated with information technology provided to public schools within the state. The information technology services provided include support for testing and assessment, student information, and fiscal information. Funding Detail Sources of Finance
(click linked fund name for more info) | 2009
Actual | 2010
Actual | 2011
Actual | 2012
Actual | 2013
Approp | | Education Fund | $0 | $0 | $0 | $0 | $2,723,700 | | Federal Funds | $0 | $0 | $0 | $0 | $2,489,400 | | Dedicated Credits Revenue | $0 | $0 | $0 | $0 | $46,300 | | Total | $0 | $0 | $0 | $0 | $5,259,400 |
|---|
| | | | | | Categories of Expenditure
(mouse-over category name for definition) | 2009
Actual | 2010
Actual | 2011
Actual | 2012
Actual | 2013
Approp |
|---|
| Personnel Services | $0 | $0 | $0 | $0 | $2,910,600 | | In-state Travel | $0 | $0 | $0 | $0 | $2,700 | | Out-of-state Travel | $0 | $0 | $0 | $0 | $9,000 | | Current Expense | $0 | $0 | $0 | $0 | $157,200 | | DP Current Expense | $0 | $0 | $0 | $0 | $258,100 | | DP Capital Outlay | $0 | $0 | $0 | $0 | $1,378,800 | | Other Charges/Pass Thru | $0 | $0 | $0 | $0 | $543,000 | | Total | $0 | $0 | $0 | $0 | $5,259,400 |
|---|
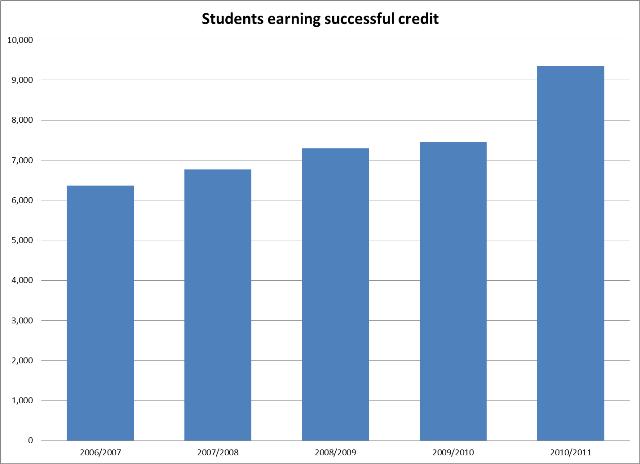
Subcommittee Table of ContentsProgram: Educational Technology Function The Educational Technology program represents costs associated with guidance to education stakeholders regarding online coursework, digital media, and other technology tools. The Program is also involved in the Utah Electronic High School. Performance The Educational Technology program considers number of logins per day and students earning successful credit as indicative of its success.
 Funding Detail Sources of Finance
(click linked fund name for more info) | 2009
Actual | 2010
Actual | 2011
Actual | 2012
Actual | 2013
Approp | | Education Fund | $0 | $0 | $0 | $0 | $148,400 | | Federal Funds | $0 | $0 | $0 | $0 | $3,177,600 | | Dedicated Credits Revenue | $0 | $0 | $0 | $0 | $36,800 | | Federal Mineral Lease | $0 | $0 | $0 | $0 | $122,900 | | Total | $0 | $0 | $0 | $0 | $3,485,700 |
|---|
| | | | | | Categories of Expenditure
(mouse-over category name for definition) | 2009
Actual | 2010
Actual | 2011
Actual | 2012
Actual | 2013
Approp |
|---|
| Personnel Services | $0 | $0 | $0 | $0 | $333,100 | | In-state Travel | $0 | $0 | $0 | $0 | $1,600 | | Out-of-state Travel | $0 | $0 | $0 | $0 | $5,100 | | Current Expense | $0 | $0 | $0 | $0 | $34,500 | | DP Current Expense | $0 | $0 | $0 | $0 | $20,300 | | Other Charges/Pass Thru | $0 | $0 | $0 | $0 | $3,091,100 | | Total | $0 | $0 | $0 | $0 | $3,485,700 |
|---|
Subcommittee Table of ContentsProgram: Federal Elementary and Secondary Education Act Function The Federal Elementary and Secondary Education Act represents costs associated with students classified as disadvantaged because of poverty, immigration status, limited English proficiency, homelessness, and/or ethnicity.
The Program comprises nine subprograms:
- Title I, Part A: Improving the Academic Achievement of the Disadvantaged;
- Title I, Part C: Migrant Education;
- Title III, Part A: Language Instruction for Limited English Proficient and Immigrant Students;
- Title IV, Part B: Century Community Learning Centers;
- Title X, Part C: Education for Homeless Children and Youths/McKinney-Vento Homeless;
- Title VII: Indian Education;
- English Language Learner Family Literacy Centers;
- Highly Impacted Schools; and
- Mathematics Engineering Science Achievement.
Funding Detail Sources of Finance
(click linked fund name for more info) | 2009
Actual | 2010
Actual | 2011
Actual | 2012
Actual | 2013
Approp | | Education Fund | $0 | $0 | $0 | $0 | $368,500 | | Federal Funds | $0 | $0 | $0 | $0 | $124,882,900 | | Transfers | $0 | $0 | $0 | $0 | $113,700 | | Total | $0 | $0 | $0 | $0 | $125,365,100 |
|---|
| | | | | | Categories of Expenditure
(mouse-over category name for definition) | 2009
Actual | 2010
Actual | 2011
Actual | 2012
Actual | 2013
Approp |
|---|
| Personnel Services | $0 | $0 | $0 | $0 | $1,701,400 | | In-state Travel | $0 | $0 | $0 | $0 | $14,500 | | Out-of-state Travel | $0 | $0 | $0 | $0 | $52,800 | | Current Expense | $0 | $0 | $0 | $0 | $786,300 | | DP Current Expense | $0 | $0 | $0 | $0 | $15,000 | | Other Charges/Pass Thru | $0 | $0 | $0 | $0 | $122,795,100 | | Total | $0 | $0 | $0 | $0 | $125,365,100 |
|---|
Subcommittee Table of ContentsProgram: Law and Legislation Function The Law and Legislation program represents the costs associated with providing legal advice to the State Board. In this capacity, staff writes and edits proposed rules, responds to GRAMA requests, interfaces with outside attorneys, deals with professional misconduct, and provides ethics training. Each year, the Program responds to about 50 administrative rules, 50-70 professional practices and licensing issues, one or more lawsuits, writes a monthly legal issue newsletter, and provides various other advice. Funding Detail Subcommittee Table of ContentsProgram: Public Relations Function The Public Relations program represents costs associated with public meetings notifications, creation of the Superintendent's Annual Report, dissemination of various student and school reports, and other communication costs. Every year the program issues around 20 press releases, produces videos related to education policy, creates two annual reports, produces 11 board summaries, creates 52 agency newsletters, produces 1 fingertip fact book, provides around 240 news summaries, creates a political and educational directory, and produces two educational calendars. Funding Detail Subcommittee Table of ContentsProgram: School Trust Function The School Trust program represents costs associated with representing the Board of Education's interest in school trust lands, providing input on investment of the permanent State School Fund, administering the School LAND Trust program in around 1,000 public schools and around 8,000 School Community Council members, and providing information to state and national policymakers. Funding Detail Subcommittee Table of ContentsProgram: Special Education Function The Special Education program represents costs associated with providing special education assistance, regulatory oversight, and professional development. Among the outputs of the program are collecting and reporting state and federal data, writing and implementing policy and procedures, monitoring, assessments and accomodations, licensure, disability specific activities, technical assistance to parents and local education agencies, professional development, completion of the state performance plan and the annual performance report, and dispute resolution. Funding Detail Revenue to the Special Education Program stems almost entirely from federal sources, with about 98 percent passed on to local education agencies. Sources of Finance
(click linked fund name for more info) | 2009
Actual | 2010
Actual | 2011
Actual | 2012
Actual | 2013
Approp | | Education Fund | $0 | $0 | $0 | $0 | $52,500 | | Federal Funds | $0 | $0 | $0 | $0 | $161,993,400 | | Total | $0 | $0 | $0 | $0 | $162,045,900 |
|---|
| | | | | | Categories of Expenditure
(mouse-over category name for definition) | 2009
Actual | 2010
Actual | 2011
Actual | 2012
Actual | 2013
Approp |
|---|
| Personnel Services | $0 | $0 | $0 | $0 | $1,817,000 | | In-state Travel | $0 | $0 | $0 | $0 | $16,700 | | Out-of-state Travel | $0 | $0 | $0 | $0 | $35,800 | | Current Expense | $0 | $0 | $0 | $0 | $1,083,400 | | DP Current Expense | $0 | $0 | $0 | $0 | $65,100 | | Other Charges/Pass Thru | $0 | $0 | $0 | $0 | $159,027,900 | | Total | $0 | $0 | $0 | $0 | $162,045,900 |
|---|
Subcommittee Table of ContentsProgram: Teaching and Learning Function The Teaching and Learning program represents overhead costs associated with compliance, service, monitoring, auditing, and reporting. The program is organized into five broad categories:
- Science-Technology-Engineering & Mathematics Education;
- Fine Arts and Humanities Education;
- Health and Physical Education; and
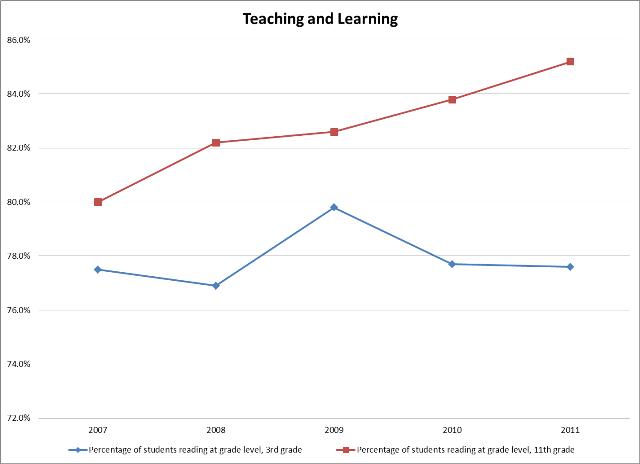
Performance The Teaching and Learning program considers the percentage of students reading at grade level as indicative of its success.
 Funding Detail Sources of Finance
(click linked fund name for more info) | 2009
Actual | 2010
Actual | 2011
Actual | 2012
Actual | 2013
Approp | | General Fund, One-time | $0 | $0 | $0 | $0 | $20,000 | | Education Fund | $0 | $0 | $0 | $0 | $3,998,400 | | Federal Funds | $0 | $0 | $0 | $0 | $21,256,700 | | Dedicated Credits Revenue | $0 | $0 | $0 | $0 | $5,138,800 | | Federal Mineral Lease | $0 | $0 | $0 | $0 | $59,000 | | Transfers | $0 | $0 | $0 | $0 | $163,800 | | Total | $0 | $0 | $0 | $0 | $30,636,700 |
|---|
| | | | | | Categories of Expenditure
(mouse-over category name for definition) | 2009
Actual | 2010
Actual | 2011
Actual | 2012
Actual | 2013
Approp |
|---|
| Personnel Services | $0 | $0 | $0 | $0 | $2,821,200 | | In-state Travel | $0 | $0 | $0 | $0 | $66,600 | | Out-of-state Travel | $0 | $0 | $0 | $0 | $51,900 | | Current Expense | $0 | $0 | $0 | $0 | $2,416,800 | | DP Current Expense | $0 | $0 | $0 | $0 | $52,700 | | Other Charges/Pass Thru | $0 | $0 | $0 | $0 | $25,227,500 | | Total | $0 | $0 | $0 | $0 | $30,636,700 |
|---|
Subcommittee Table of ContentsProgram: Board of Education - Administration Function Prior to the 2012 General Session, the USOE was divided into four appropriation units, of which Board of Education - Administration was one. This broad appropriation unit is now accounted for within the new appropriation units. Funding Detail Sources of Finance
(click linked fund name for more info) | 2009
Actual | 2010
Actual | 2011
Actual | 2012
Actual | 2013
Approp | | Uniform School Fund | $2,017,400 | $2,289,800 | $0 | $0 | $0 | | Uniform School Fund, One-time | $1,865,000 | ($3,300) | $0 | $0 | $0 | | Education Fund | $0 | $0 | $2,470,600 | $1,808,000 | $0 | | Education Fund, One-time | $0 | $0 | $0 | $818,200 | $0 | | Dedicated Credits Revenue | $8,400 | $41,000 | $124,200 | $200,100 | $0 | | Federal Mineral Lease | $2,866,200 | $1,944,300 | $2,216,800 | $2,646,800 | $0 | | GFR - Land Exchange Distribution Account | $302,400 | $292,700 | $302,400 | $302,400 | $0 | | Beginning Nonlapsing | $2,130,200 | $4,850,100 | $4,958,700 | $4,326,700 | $0 | | Closing Nonlapsing | ($6,713,400) | ($6,825,500) | ($6,012,400) | ($6,982,800) | $0 | | Lapsing Balance | ($25,300) | $0 | ($36,900) | ($1,679,100) | $0 | | Total | $2,450,900 | $2,589,100 | $4,023,400 | $1,440,300 | $0 |
|---|
| | | | | | Categories of Expenditure
(mouse-over category name for definition) | 2009
Actual | 2010
Actual | 2011
Actual | 2012
Actual | 2013
Approp |
|---|
| Personnel Services | $703,500 | $576,700 | $796,200 | $669,100 | $0 | | In-state Travel | $42,400 | $44,400 | $52,500 | $54,100 | $0 | | Out-of-state Travel | $25,200 | $44,300 | $20,800 | $24,400 | $0 | | Current Expense | $575,400 | $1,047,400 | $1,788,600 | $0 | $0 | | DP Current Expense | $97,900 | $52,700 | $158,400 | $164,800 | $0 | | DP Capital Outlay | $0 | $171,100 | $122,900 | $320,100 | $0 | | Other Charges/Pass Thru | $1,006,500 | $652,500 | $1,084,000 | $207,800 | $0 | | Total | $2,450,900 | $2,589,100 | $4,023,400 | $1,440,300 | $0 |
|---|
| | | | | | | Other Indicators | 2009
Actual | 2010
Actual | 2011
Actual | 2012
Actual | 2013
Approp |
|---|
| Budgeted FTE | 2.8 | 3.0 | 4.0 | 3.0 | 4.0 | | Actual FTE | 2.8 | 2.0 | 4.6 | 5.8 | 0.0 | | Vehicles | 0 | 0 | 6 | 6 | 6 |
|
|
|
|
|
|
|---|
Subcommittee Table of ContentsProgram: Student Achievement Function Prior to the 2012 General Session, the USOE was divided into four appropriation units, of which Student Achievement was one. This broad appropriation unit is now accounted for within the new appropriation units. Funding Detail Sources of Finance
(click linked fund name for more info) | 2009
Actual | 2010
Actual | 2011
Actual | 2012
Actual | 2013
Approp | | Uniform School Fund | $22,715,300 | $16,410,200 | $0 | $0 | $0 | | Uniform School Fund, One-time | $1,395,100 | ($346,000) | $0 | $0 | $0 | | Education Fund | $0 | $0 | $16,507,600 | $16,689,000 | $0 | | Education Fund, One-time | $0 | $0 | $7,700 | $0 | $0 | | Federal Funds | $235,440,000 | $224,341,000 | $339,854,600 | $307,221,900 | $0 | | American Recovery and Reinvestment Act | $3,088,800 | $31,580,700 | $0 | $0 | $0 | | Dedicated Credits Revenue | $363,800 | $872,900 | $5,260,200 | $5,238,400 | $0 | | Federal Mineral Lease | $712,800 | $765,900 | $629,200 | $545,100 | $0 | | GFR - Substance Abuse Prevention | $494,500 | $490,600 | $497,200 | $497,000 | $0 | | Transfers | $3,919,900 | $0 | $917,600 | $0 | $0 | | Transfers - Interagency | $0 | $1,454,800 | $0 | $1,110,900 | $0 | | Beginning Nonlapsing | $7,228,300 | $3,430,800 | $7,217,800 | $6,084,700 | $0 | | Closing Nonlapsing | ($1,719,100) | ($737,200) | ($4,508,100) | ($3,940,100) | $0 | | Lapsing Balance | ($3,900) | $0 | ($13,600) | ($12,700) | $0 | | Total | $273,635,500 | $278,263,700 | $366,370,200 | $333,434,200 | $0 |
|---|
| | | | | | Categories of Expenditure
(mouse-over category name for definition) | 2009
Actual | 2010
Actual | 2011
Actual | 2012
Actual | 2013
Approp |
|---|
| Personnel Services | $15,241,100 | $14,501,700 | $14,601,700 | $14,209,600 | ($10,000) | | In-state Travel | $137,700 | $177,700 | $171,700 | $126,900 | $0 | | Out-of-state Travel | $148,700 | $131,900 | $215,200 | $229,700 | $0 | | Current Expense | $23,407,200 | $17,086,300 | $13,946,600 | $12,079,400 | ($10,000) | | DP Current Expense | $571,900 | $549,100 | $449,400 | $669,400 | $0 | | DP Capital Outlay | $161,600 | $462,300 | $1,695,700 | $630,700 | $0 | | Other Charges/Pass Thru | $233,967,300 | $245,354,700 | $335,289,900 | $305,488,500 | $20,000 | | Total | $273,635,500 | $278,263,700 | $366,370,200 | $333,434,200 | $0 |
|---|
| | | | | | | Other Indicators | 2009
Actual | 2010
Actual | 2011
Actual | 2012
Actual | 2013
Approp |
|---|
| Budgeted FTE | 178.9 | 182.0 | 182.0 | 177.0 | 174.1 | | Actual FTE | 179.3 | 171.9 | 171.2 | 164.3 | 0.0 |
|
|
|
|
|
|
|---|
Subcommittee Table of ContentsProgram: Data and Business Services Function Prior to the 2012 General Session, the USOE was divided into four appropriation units, of which Data and Business Services was one. This broad appropriation unit is now accounted for within the new appropriation units. Funding Detail Sources of Finance
(click linked fund name for more info) | 2009
Actual | 2010
Actual | 2011
Actual | 2012
Actual | 2013
Approp | | Uniform School Fund | $1,077,900 | $1,099,300 | $0 | $0 | $0 | | Uniform School Fund, One-time | $195,300 | ($16,400) | $0 | $0 | $0 | | Education Fund | $0 | $0 | $1,408,200 | $1,533,400 | $0 | | Federal Funds | $9,400 | $6,900 | $8,400 | $13,600 | $0 | | Total | $1,282,600 | $1,089,800 | $1,416,600 | $1,547,000 | $0 |
|---|
| | | | | | Categories of Expenditure
(mouse-over category name for definition) | 2009
Actual | 2010
Actual | 2011
Actual | 2012
Actual | 2013
Approp |
|---|
| Personnel Services | $1,040,500 | $893,700 | $1,165,500 | $1,288,500 | $0 | | In-state Travel | $2,300 | $1,400 | $9,700 | $5,700 | $0 | | Out-of-state Travel | $12,200 | $6,700 | $8,300 | $3,300 | $0 | | Current Expense | $85,600 | $67,700 | $81,600 | $75,900 | $0 | | DP Current Expense | $6,500 | $500 | $1,200 | $9,100 | $0 | | Other Charges/Pass Thru | $135,500 | $119,800 | $150,300 | $164,500 | $0 | | Total | $1,282,600 | $1,089,800 | $1,416,600 | $1,547,000 | $0 |
|---|
| | | | | | | Other Indicators | 2009
Actual | 2010
Actual | 2011
Actual | 2012
Actual | 2013
Approp |
|---|
| Budgeted FTE | 11.6 | 12.0 | 10.0 | 13.0 | 12.6 | | Actual FTE | 11.6 | 9.8 | 12.3 | 13.3 | 0.0 | | Vehicles | 7 | 7 | 1 | 1 | 1 |
|
|
|
|
|
|
|---|
Subcommittee Table of ContentsProgram: Law, Legislation and Educational Services Function Prior to the 2012 General Session, the USOE was divided into four appropriation units, of which Law, Legislation, and Educational Services was one. This broad appropriation unit is now accounted for within the new appropriation units. Funding Detail The FY 2010 actual nonlapsing of $4,798,100 does not match the FY 2011 beginning nonlapsing because of accounting changes:
- Licensure changed from the Law, Legislation, and Educational Services program to the Teaching and Learning program; thus, drivers education credits were transferred to Teaching and Learning;
- Federal Mineral Lease was accounted for in the Board program in FY 2010 and was changed to Law, Legislation, and Educational Services in FY 2011.
Sources of Finance
(click linked fund name for more info) | 2009
Actual | 2010
Actual | 2011
Actual | 2012
Actual | 2013
Approp | | General Fund | $2,312,500 | $0 | $0 | $0 | $0 | | General Fund, One-time | $1,090,600 | $0 | $0 | $0 | $0 | | Uniform School Fund | $1,212,000 | $1,290,000 | $0 | $0 | $0 | | Uniform School Fund, One-time | $82,300 | ($69,200) | $0 | $0 | $0 | | Education Fund | $0 | $0 | $716,900 | $666,200 | $0 | | Federal Funds | $1,169,400 | $485,500 | $4,100 | $0 | $0 | | Dedicated Credits Revenue | $5,022,300 | $4,982,300 | $0 | $0 | $0 | | Federal Mineral Lease | $156,900 | $93,800 | $188,800 | $166,700 | $0 | | Interest and Dividends Account | $409,700 | $409,200 | $410,400 | $409,400 | $0 | | Beginning Nonlapsing | $5,445,800 | $5,962,700 | $184,300 | $224,400 | $0 | | Closing Nonlapsing | ($5,845,100) | ($4,798,100) | ($115,300) | ($85,200) | $0 | | Total | $11,056,400 | $8,356,200 | $1,389,200 | $1,381,500 | $0 |
|---|
| | | | | | Categories of Expenditure
(mouse-over category name for definition) | 2009
Actual | 2010
Actual | 2011
Actual | 2012
Actual | 2013
Approp |
|---|
| Personnel Services | $1,980,800 | $1,670,100 | $994,700 | $931,600 | $0 | | In-state Travel | $6,000 | $8,100 | $4,300 | $6,200 | $0 | | Out-of-state Travel | $24,600 | $16,000 | $5,100 | $12,500 | $0 | | Current Expense | $3,095,000 | $1,290,700 | $184,300 | $185,600 | $0 | | DP Current Expense | $25,000 | $16,100 | $12,900 | $22,000 | $0 | | Other Charges/Pass Thru | $5,925,000 | $5,355,200 | $187,900 | $223,600 | $0 | | Total | $11,056,400 | $8,356,200 | $1,389,200 | $1,381,500 | $0 |
|---|
| | | | | | | Other Indicators | 2009
Actual | 2010
Actual | 2011
Actual | 2012
Actual | 2013
Approp |
|---|
| Budgeted FTE | 20.4 | 23.0 | 21.0 | 12.0 | 10.0 | | Actual FTE | 20.4 | 20.7 | 11.0 | 10.6 | 0.0 |
|
|
|
|
|
|
|---|
Subcommittee Table of Contents |