Agency: ISF - Administrative Services Line Item: ISF - Fleet Operations Function The Division of Fleet Operations was established as a new division of Administrative Services in 1997. Fleet is charged with handling State Vehicle acquisition, repair, preventive maintenance, surplus, and fueling of state vehicles. Statutory Authority UCA 63A Chapter 9 creates the Division of Fleet Operations (Section 201) and delineates the division's duties (Section 401). Duties include: - Perform all administrative duties related to managing the state's vehicles
- Coordinate all purchases of state vehicles
- Establish fleet information system(s) for state vehicles
- Make rules regarding maintenance, safety, loss prevention, procurement, fuel management, cost management, disposal, reallocation, rate structures, and insurance requirements for state vehicles
- Establish a parts inventory
- Create and administer a fuel dispensing service
- Emphasize customer service
- Conduct an annual audit of all state vehicles
- Charge rates approved by the Rate Committee and Legislature
- Conduct a market analysis
- By November 1 of each year submit a state-owned vehicle report to the governor and legislative fiscal analyst
UCA 63A-9-601 requires the division to ensure that vehicles owned or leased by the state are properly marked UCA 63A-9-801 requires the division to establish a state surplus property system UCA 63A-9-805 allows the division to establish a federal surplus property system UCA 63A-9-401.5 requires the division to develop and coordinate the implementation of a statewide vehicle fleet cost efficiency plan, which includes: - Goals for vehicle fleet cost efficiency
- A summary of agency submitted, plans, statistics, and progress
- Standard measures of cost including vehicle cost per mile, total vehicles, total fuel used, and miles per gallon
- Goals for purchasing the most economically appropriate size and type of vehicle
- Cost reduction measures
- reducing inventories of underutilized vehicles
Intent Language Under Section 63J-1-603 of the Utah Code the Legislature intends that appropriations provided for the Department of Administrative Services - Division of Fleet Operations in Item 42 of Chapter 396 Laws of Utah 2009 not lapse capital outlay authority granted within Fiscal Year 2010 for vehicles not delivered by the end of Fiscal Year 2010 in which vehicle purchase orders were issued obligating capital outlay funds. Performance Administration costs should be kept as low as possible so resources can be used for providing services to customer agencies. 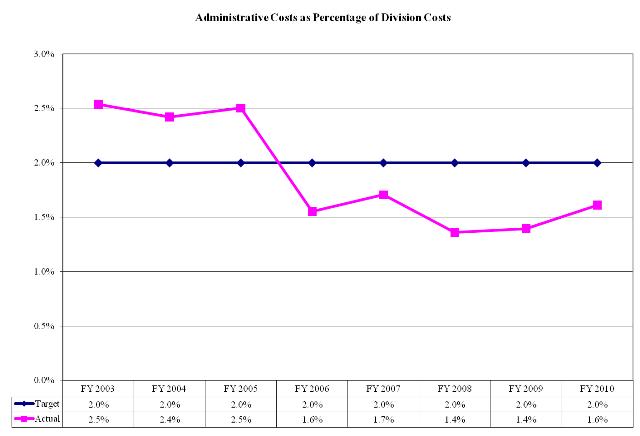 Measure: Administrative costs as a percentage of total division costs. Goal: Maintain administrative costs below two percent of total division
budget. Methodology: Ratio between total administrative expenses versus total
division budget. Measure Type: Outcome. The chart shows vehicle count by major agency (those having over 350 vehicles) per year. Total vehicle count for these agencies was down by 35 vehicles in FY 2010 compared to FY 2009, and down by 152 from its peak of 7,453 in FY 2008 (Source: Division of Fleet Operations). 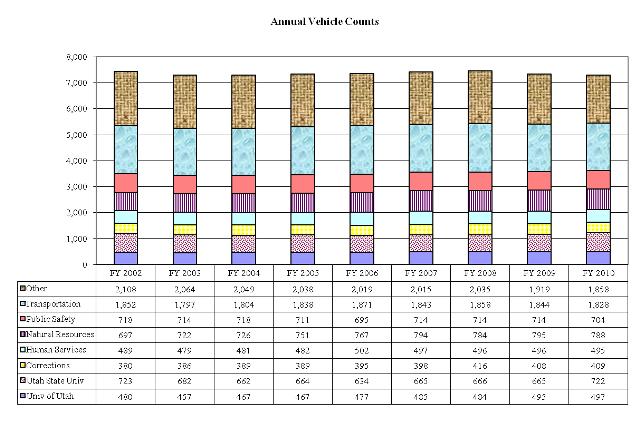 Funding Detail This budgetary line item contains five programs; however, the Administration program exists only to account for overhead costs of services provided to the other four programs. | Sources of Finance | 2007
Actual | 2008
Actual | 2009
Actual | 2010
Actual | 2011
Approp | | Dedicated Credits - Intragvt Rev | $61,119,400 | $71,374,200 | $61,286,000 | $56,520,400 | $61,657,900 | | Sale of Fixed Assets | $552,300 | $182,200 | ($179,700) | ($1,351,100) | $0 | | Total | $61,671,700 | $71,556,400 | $61,106,300 | $55,169,300 | $61,657,900 |
|---|
| | Programs: | 2007
Actual | 2008
Actual | 2009
Actual | 2010
Actual | 2011
Approp | | ISF - Motor Pool | $26,583,700 | $29,541,500 | $26,765,500 | $23,268,900 | $27,317,100 | | ISF - Fuel Network | $33,937,000 | $41,054,800 | $33,253,700 | $30,846,700 | $33,253,700 | | ISF - State Surplus Property | $1,113,200 | $946,300 | $1,073,200 | $944,800 | $1,073,200 | | ISF - Federal Surplus Property | $37,800 | $13,800 | $13,900 | $108,900 | $13,900 | | Total | $61,671,700 | $71,556,400 | $61,106,300 | $55,169,300 | $61,657,900 |
|---|
| | Categories of Expenditure | 2007
Actual | 2008
Actual | 2009
Actual | 2010
Actual | 2011
Approp | | Personnel Services | $2,218,900 | $2,451,800 | $2,600,800 | $2,504,900 | $2,664,400 | | In-state Travel | $15,900 | $25,400 | $6,900 | $2,100 | $7,000 | | Out-of-state Travel | $8,600 | $8,600 | $4,100 | $3,900 | $4,300 | | Current Expense | $43,096,300 | $54,693,000 | $47,327,200 | $43,724,800 | $47,618,400 | | DP Current Expense | $594,000 | $656,300 | $655,900 | $668,500 | $762,500 | | Other Charges/Pass Thru | $113,300 | $117,500 | $251,200 | $155,200 | $155,000 | | Operating Transfers | $0 | $0 | $1,436,500 | $0 | $0 | | Depreciation | $11,257,200 | $11,381,200 | $10,113,900 | $10,509,100 | $10,756,200 | | Total | $57,304,200 | $69,333,800 | $62,396,500 | $57,568,500 | $61,967,800 |
|---|
| | Other Indicators | 2007
Actual | 2008
Actual | 2009
Actual | 2010
Actual | 2011
Approp | | Budgeted FTE | 42.9 | 43.0 | 38.4 | 38.0 | 38.0 | | Authorized Capital Outlay | $13,018,600 | $19,938,400 | $11,736,500 | $13,290,600 | $21,025,100 | | Retained Earnings | $10,599,400 | $12,822,300 | $11,532,100 | $9,132,700 | $11,576,000 | | Vehicles | 43 | 46 | 14 | 18 | 14 |
|
|
|
|
|
|
Subcommittee Table of ContentsProgram: ISF - Fleet Administration Function The Administration program is responsible for the management, accounting and budget functions of the Division of Fleet Operations. This program is also responsible for billing and associated activities. It coordinates the annual rate package and distributes the annual budget for the division. Funding Detail All expenses in this program are passed through to the programs in proportion to their share of the total division budget. | Sources of Finance | 2007
Actual | 2008
Actual | 2009
Actual | 2010
Actual | 2011
Approp | | Total | $0 | $0 | $0 | $0 | $0 |
|---|
| | Categories of Expenditure | 2007
Actual | 2008
Actual | 2009
Actual | 2010
Actual | 2011
Approp | | Personnel Services | $524,800 | $572,200 | $531,700 | $576,500 | $532,400 | | In-state Travel | $800 | $500 | $0 | $0 | $0 | | Out-of-state Travel | $4,800 | $1,800 | $2,300 | $900 | $2,000 | | Current Expense | $115,800 | $78,100 | $79,800 | $53,700 | $100,000 | | DP Current Expense | $138,900 | $135,600 | $115,900 | $126,900 | $460,700 | | Other Charges/Pass Thru | ($785,100) | ($788,200) | ($729,700) | ($758,000) | ($1,095,100) | | Total | $0 | $0 | $0 | $0 | $0 |
|---|
| | Other Indicators | 2007
Actual | 2008
Actual | 2009
Actual | 2010
Actual | 2011
Approp | | Budgeted FTE | 6.7 | 4.8 | 5.7 | 5.0 | 5.0 | | Retained Earnings | $9,100 | $9,100 | $9,100 | $9,100 | $9,100 |
|
|
|
|
|
|
Subcommittee Table of ContentsProgram: ISF - Motor Pool Function This program is responsible the management of the statewide fleet, the central motor pool, safety objectives/compliance, and the statewide fleet management information system. The motor pool accounts for all state vehicles, even though a portion of those vehicles are administered in higher education fleets. The program also administers the vehicle accident management program and complies with the federal Energy Policy Act. Funding Detail | Sources of Finance | 2007
Actual | 2008
Actual | 2009
Actual | 2010
Actual | 2011
Approp | | Dedicated Credits - Intragvt Rev | $26,031,400 | $29,359,300 | $26,945,200 | $24,620,000 | $27,317,100 | | Sale of Fixed Assets | $552,300 | $182,200 | ($179,700) | ($1,351,100) | $0 | | Total | $26,583,700 | $29,541,500 | $26,765,500 | $23,268,900 | $27,317,100 |
|---|
| | Categories of Expenditure | 2007
Actual | 2008
Actual | 2009
Actual | 2010
Actual | 2011
Approp | | Personnel Services | $674,800 | $789,900 | $939,000 | $832,100 | $1,000,100 | | In-state Travel | $8,300 | $22,100 | $6,000 | $1,300 | $6,000 | | Out-of-state Travel | $2,600 | $5,900 | $1,800 | $1,700 | $1,800 | | Current Expense | $11,685,200 | $16,196,600 | $15,303,000 | $14,094,500 | $15,482,700 | | DP Current Expense | $334,800 | $399,600 | $413,300 | $423,700 | $197,900 | | Other Charges/Pass Thru | $460,500 | $464,800 | $435,200 | $339,600 | $622,700 | | Depreciation | $11,089,700 | $11,215,600 | $9,932,400 | $10,290,800 | $10,333,700 | | Total | $24,255,900 | $29,094,500 | $27,030,700 | $25,983,700 | $27,644,900 |
|---|
| | Other Indicators | 2007
Actual | 2008
Actual | 2009
Actual | 2010
Actual | 2011
Approp | | Budgeted FTE | 19.5 | 20.8 | 15.2 | 15.0 | 15.1 | | Authorized Capital Outlay | $12,965,000 | $19,798,800 | $11,643,600 | $12,724,900 | $20,813,100 | | Retained Earnings | $5,693,600 | $6,140,600 | $5,875,500 | $3,160,600 | $5,291,200 | | Vehicles | 36 | 36 | 6 | 9 | 6 |
|
|
|
|
|
|
Subcommittee Table of ContentsProgram: ISF - Fuel Network Function The Fuel Network manages the state's fuel purchase contracts and the state's fuel infrastructure; which includes the statewide underground storage tank program and consolidated electronic refueling stations. The Fuel Network uses capital outlay authorizations primarily to replace card readers and fuel tank monitors. Funding Detail Historical increases and decreases in revenues and expenditures have largely been attributable to fuel costs; not to changes in consumption. | Sources of Finance | 2007
Actual | 2008
Actual | 2009
Actual | 2010
Actual | 2011
Approp | | Dedicated Credits - Intragvt Rev | $33,937,000 | $41,054,800 | $33,253,700 | $30,846,700 | $33,253,700 | | Total | $33,937,000 | $41,054,800 | $33,253,700 | $30,846,700 | $33,253,700 |
|---|
| | Categories of Expenditure | 2007
Actual | 2008
Actual | 2009
Actual | 2010
Actual | 2011
Approp | | Personnel Services | $544,800 | $581,500 | $591,800 | $583,600 | $572,700 | | In-state Travel | $6,500 | $1,700 | $0 | $200 | $0 | | Out-of-state Travel | $1,200 | $900 | $0 | $0 | $0 | | Current Expense | $31,025,200 | $38,131,700 | $31,726,600 | $29,244,900 | $31,726,400 | | DP Current Expense | $48,500 | $88,000 | $56,400 | $45,100 | $40,200 | | Other Charges/Pass Thru | $260,400 | $280,100 | $344,800 | $456,100 | $359,800 | | Operating Transfers | $0 | $0 | $1,436,500 | $0 | $0 | | Depreciation | $137,400 | $135,500 | $149,500 | $185,300 | $390,500 | | Total | $32,024,000 | $39,219,400 | $34,305,600 | $30,515,200 | $33,089,600 |
|---|
| | Other Indicators | 2007
Actual | 2008
Actual | 2009
Actual | 2010
Actual | 2011
Approp | | Budgeted FTE | 8.8 | 8.8 | 8.3 | 9.0 | 8.6 | | Authorized Capital Outlay | $53,600 | $139,600 | $63,600 | $565,700 | $200,000 | | Retained Earnings | $4,504,200 | $6,339,700 | $5,287,700 | $5,619,100 | $6,126,900 | | Vehicles | 2 | 3 | 2 | 2 | 2 |
|
|
|
|
|
|
Subcommittee Table of ContentsProgram: ISF - State Surplus Property Function The Division sells state agency surplus property to the public subject to a 30-day purchase priority that is given to state and local government agencies. The best possible price is obtained by using varied sales methods including: warehouse direct sales, sealed bids, spot bids, auction sales to the public, and internet-based auctions. The rate structure for State Surplus Property allows the program to retain total proceeds from sales in order to fund operating expenses. If the program earns a profit and shows a positive retained earnings balance, State Surplus may proportionately rebate profits to state agencies. In addition to properly disposing of equipment in accordance with environmental law, State Surplus Property provides a consistent accountability structure for the disposal of property. A central system protects the state against fraud and claims of fraud in the disposition of surplus property. Funding Detail | Sources of Finance | 2007
Actual | 2008
Actual | 2009
Actual | 2010
Actual | 2011
Approp | | Dedicated Credits - Intragvt Rev | $1,113,200 | $946,300 | $1,073,200 | $944,800 | $1,073,200 | | Total | $1,113,200 | $946,300 | $1,073,200 | $944,800 | $1,073,200 |
|---|
| | Categories of Expenditure | 2007
Actual | 2008
Actual | 2009
Actual | 2010
Actual | 2011
Approp | | Personnel Services | $474,200 | $506,300 | $531,700 | $504,200 | $548,800 | | In-state Travel | $300 | $1,100 | $900 | $600 | $1,000 | | Out-of-state Travel | $0 | $500 | ($500) | $800 | $0 | | Current Expense | $270,100 | $286,500 | $210,900 | $227,000 | $302,400 | | DP Current Expense | $75,100 | $28,300 | $70,300 | $72,800 | $63,700 | | Other Charges/Pass Thru | $177,500 | $160,800 | $200,900 | $114,200 | $267,600 | | Depreciation | $30,100 | $30,100 | $32,000 | $33,000 | $32,000 | | Total | $1,027,300 | $1,013,600 | $1,046,200 | $952,600 | $1,215,500 |
|---|
| | Other Indicators | 2007
Actual | 2008
Actual | 2009
Actual | 2010
Actual | 2011
Approp | | Budgeted FTE | 7.9 | 8.6 | 8.8 | 8.0 | 8.8 | | Authorized Capital Outlay | $0 | $0 | $29,300 | $0 | $12,000 | | Retained Earnings | $422,300 | $358,500 | $385,500 | $377,700 | $115,300 | | Vehicles | 5 | 7 | 6 | 7 | 6 |
|
|
|
|
|
|
Subcommittee Table of ContentsProgram: ISF - Federal Surplus Property Function The Federal Surplus Program acquires and donates federal property to public and non-profit agencies. A handling fee is charged to agencies acquiring surplus property. These dedicated credits fund the operation while offering a means for state, county, and local agencies to purchase equipment at reduced rates. During the 2004 General Session the Legislature decided to reduce this non-essential program to merely an agent to acquire federal property when requested from state or local entities. Funding Detail | Sources of Finance | 2007
Actual | 2008
Actual | 2009
Actual | 2010
Actual | 2011
Approp | | Dedicated Credits - Intragvt Rev | $37,800 | $13,800 | $13,900 | $108,900 | $13,900 | | Total | $37,800 | $13,800 | $13,900 | $108,900 | $13,900 |
|---|
| | Categories of Expenditure | 2007
Actual | 2008
Actual | 2009
Actual | 2010
Actual | 2011
Approp | | Personnel Services | $300 | $1,900 | $6,600 | $8,500 | $10,400 | | Out-of-state Travel | $0 | ($500) | $500 | $500 | $500 | | Current Expense | $0 | $100 | $6,900 | $104,700 | $6,900 | | DP Current Expense | ($3,300) | $4,800 | $0 | $0 | $0 | | Other Charges/Pass Thru | $0 | $0 | $0 | $3,300 | $0 | | Total | ($3,000) | $6,300 | $14,000 | $117,000 | $17,800 |
|---|
| | Other Indicators | 2007
Actual | 2008
Actual | 2009
Actual | 2010
Actual | 2011
Approp | | Budgeted FTE | 0.1 | 0.0 | 0.4 | 1.0 | 0.5 | | Retained Earnings | ($29,800) | ($25,600) | ($25,700) | ($33,800) | $33,500 |
|
|
|
|
|
|
Subcommittee Table of Contents |