Compendium of Budget Information for the 2011 General Session
| Business, Economic Development, & Labor Appropriations Subcommittee | |||||||||||||||||||||||||||||||||||||||||||||||||||||||||||||||||||||||||||||||||||||||||||||||||||||||||||||||||||||||||||||||||||||||||||||||||||||||||||||||||||||||||||||||||||||||||||||||||||||||||||||||||||||||||||||||||||||||||||||||||||||||||||||||||||||||||||||||||||||||||||||||||||||||||||||||||||||||||||||||||||||||||||||||||||||||||||||||||||||||||||||||||||||||||||||||||||||||||||||||||||||||||||||||||||||||||||||||||||||||||||||||||||||||||||||||||||||||||||||||||||||||||||||||||||||||||||||||||||||||||||||||||||||||||||||||||||||||||||||||||||||||||||||||||||||||||||||||||||||||||||||||||||||||||||||||||||||||||||||||||||||||||||||||||||||||||||||||||||||||||||||||||||||||||||||||||||||||||||||||||||||||||||||||||||||||||||||||||||||||||||||||||||||||||||||||||||||||||||||||||||||||||||||||||||||||||||||||||||||||||||||||||||||||||||||||||||||||||||||||||||||||||||||||||||||||||||||||||||||||||||||||||||||||||||||||||||||||||||||||||||||||||||||||||||||||||||||||||||||||
| Subcommittee Table of Contents | |||||||||||||||||||||||||||||||||||||||||||||||||||||||||||||||||||||||||||||||||||||||||||||||||||||||||||||||||||||||||||||||||||||||||||||||||||||||||||||||||||||||||||||||||||||||||||||||||||||||||||||||||||||||||||||||||||||||||||||||||||||||||||||||||||||||||||||||||||||||||||||||||||||||||||||||||||||||||||||||||||||||||||||||||||||||||||||||||||||||||||||||||||||||||||||||||||||||||||||||||||||||||||||||||||||||||||||||||||||||||||||||||||||||||||||||||||||||||||||||||||||||||||||||||||||||||||||||||||||||||||||||||||||||||||||||||||||||||||||||||||||||||||||||||||||||||||||||||||||||||||||||||||||||||||||||||||||||||||||||||||||||||||||||||||||||||||||||||||||||||||||||||||||||||||||||||||||||||||||||||||||||||||||||||||||||||||||||||||||||||||||||||||||||||||||||||||||||||||||||||||||||||||||||||||||||||||||||||||||||||||||||||||||||||||||||||||||||||||||||||||||||||||||||||||||||||||||||||||||||||||||||||||||||||||||||||||||||||||||||||||||||||||||||||||||||||||||||||||||||
Background The Tax Administration line item includes 10 program areas: Tax Administration, Auditing Division, Multi-State Tax Compact, Technology Management, Processing Division, Seasonal Employees, Tax Payer Services, Property Tax, Motor Vehicles, and the Motor Vehicle Enforcement Division. Intent Language
Funding Detail
Program: Administration Division Function The Administration Division includes the Commissioners' and the Executive Director's Offices. Both offices provide direction and management to the Department. The Commissioners' Office:
The Executive Director's section:
Performance Work Product Universe: In FY 2011, the Division expects to deal with 3,673 appeals, about 500 statistical data and fiscal note requests, fraud investigations, and local government revenue issues. Some indications of the success of the Administration Division include successful oversight of the tax system implementation process, timely distribution of revenue, and training hours provided. The Office also seeks to reduce the time required for appeals; since FY 2000, the cleared appeals has ranged from a low of 1,400 to a high of 3,441. In FY 2010, the Division finalized 3,441 appeals. The increase is due to property tax appeals. 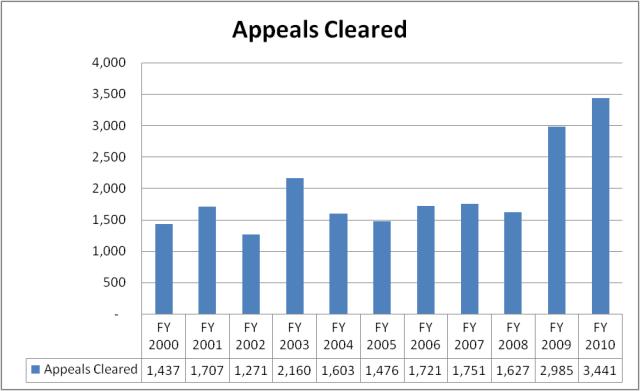 Funding Detail State funds account for most of the Administration Division's financing. With 56.25 budgeted full-time-equivalent employees, the Division's primary category of expenditure is personal services. Of the 56.25 budgeted employees, the largest share of total personnel expenditures is on executive leadership ($1,402,357), followed by financial analysts and financial managers ($805,739), administrative law judges ($522,517), and economists ($359,654). Top expenditure items within the current expense category include tax system project costs (vendor costs) (28%), human resource & payroll services (6%), and data processing software maintenance costs (2%). During the 2008 Second Special Session, the Legislature authorized use of $5 million one-time funding from the Sales & Use Tax Administrative Fee account, which replaced a $5 million one-time decrease in General Funds. The increase in nonlapsing balance at the end of FY 2008 was due to timing of payments made to the contractor for the tax system modernization effort.
Function The Auditing Division attempts to increase voluntary and involunatary taxpayer compliance through selective examination of taxpayer returns and supporting records. The Division audits all taxes except property tax (local level), and conducts audits in-house and at taxpayers' places of business. The Division emphasizes compliance audits for investigation of suspected fraud and tax evasion. Through educational outreach and customer service, the Division works to help taxpayers report future taxes properly. Performance Work Product Universe: The coverage areas for the Auditing Division include about 1.2 million income tax returns and about another 0.8 million business returns. The following chart details audit satisfaction on a scale from one to five. A rating of five indicates the taxpayer "strongly agrees" with the statement, "overall, I was satisfied with the manner in which the audit was conducted," and a rating of one means the taxpayer "strongly disagrees" with the statement. Over the past ten years, the Division has consistently maintained a rating between four and five. 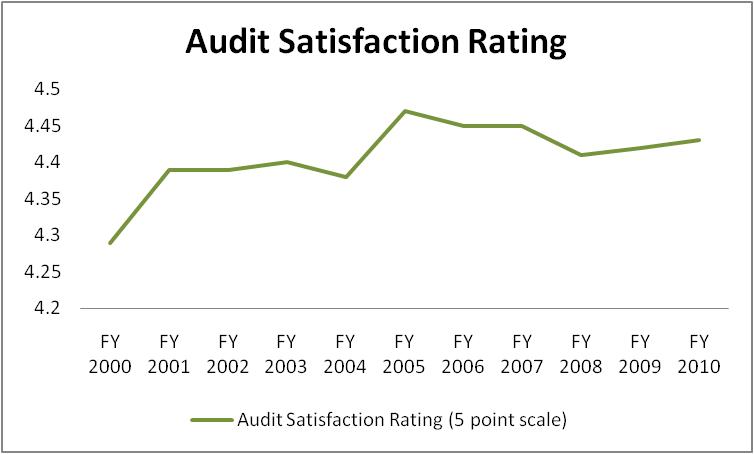 The Auditing Division also considers indicative of its success the number of new accounts discovered (sales and corporate) from auditing activities. The chart that follows represents new accounts discovered over the past four years. 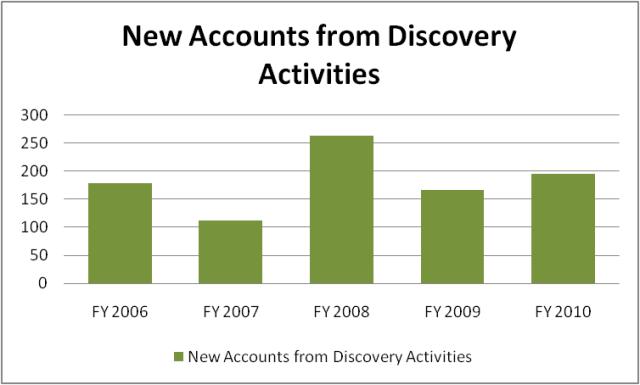 Another measurement of performance success is whether the number of income tax audits performed is increasing. The table below represents indexes of the number of income tax audits performed and the hours spent on income tax. After three years of declines, the number of individual income tax audits performed is up 19% over FY 2009.  Funding Detail The three largest sources of finance for the Auditing Division are the General Fund, Education Fund, and the Sales and Use Tax Administrative Fees Account. As authorized in statute, funding from the sales and use tax fee stems from the Commission practice of keeping a percentage of total sales tax collected for local entities to offset the costs of collection. In terms of expenditure accounting, the largest portion of Auditing Division expenditures is on salary and benefits, comprising $9,238,700 in FY 2010 (93% of total Division expenditures). Because the Auditing Division often deals with national and international companies, the Division is required to visit these companies at the businesses' places of record-keeping. The out-of-state travel budget comprised visits to 72 cities in FY 2010. The largest expenditure item within the current expense category is building & grounds office supply and maintenance (1%).
Program: Multi-State Tax Compact Function The Multi-State Tax Compact (MTC) is a group of state governments working together to help make state tax systems fair, effective, and efficient as for interstate and international commerce. It is also an effort to protect state tax sovereignty. The Compact's two primary projects are the joint audit program and the National Nexus Program. The joint audit program reviews a business' sales and corporate income tax filings for several states at the same time. Accordingly, the audit program encourages compliance with state tax laws, generates tax revenues for states, contributes to uniformity in taxpayer treatment, and helps states learn about new industry conditions and circumstances. The National Nexus Program encourages voluntary disclosure and discovers businesses that are not filing returns with states. The Nexus program facilitates an exchange of information between states to identify business reporting or filing inconsistencies among these states. The State is not required to be a member of the MTC, but the Tax Commission does utilize the work of the MTC in that assessments from MTC audits (a percentage of the assessments turn into collections) amounted to $1.4 million in FY 2008, $3.9 million in FY 2009, and $2.5 million in FY 2010. Statutory Authority Although the State is not required to be a member of the MTC, Utah Annotated Code Title 59, Chapter 1, Section 801 states that the Legislature approves of Utah's membership. Funding Detail Funding for the Multi-State Tax Compact is made up entirely of General Fund, Education Fund, and the Sales and Use Tax Administrative Fees Account. Annual expenditures represent membership dues.
Program: Technology Management Function The Department of Technology Services (DTS) now operates and maintains the Tax Commission's 60 different automated systems. It also develops and installs new automated systems to meet specialized demands. In addition, DTS provides service to internal customers through a system-wide 'help desk.' The Tax Commission continues to modernize tax and motor vehicle systems and processes. New funding to replace the state's core tax systems was initiated in 2006 with a one-time appropriation of $7 million to DTS. During the 2007 General Session, project funding included $5 million as part of the total payment towards replacing the existing system, and during the 2008 General Session another $6 million was appropriated for the project. The total vendor cost to replace the existing core systems is $22.5 million, with $4.5 million of this stemming from savings from other areas of the Tax Commission's appropriations. This project will include the replacement of the automated systems used to process, record, and distribute sales tax, income tax, employer withholding tax, corporate tax, motor and special fuel taxes, and other fuel taxes. Replacement of the income tax system was implemented in January 2007; implementation of the sales tax system occurred in March 2008; implementation of the corporate withholding, streamlined sales tax occurred in March 2009; implementation of Taxpayer Access Portal for Income & Sales occurred in April-December 2009; and implementation of the fuel taxes and miscellaneous taxes occurred in January - September 2010. A new delinquent tax collection tracking system has improved collection tools and processes. The new motor vehicle system allows the online update of vehicle information. The Salt Lake motor vehicle offices are now using an automated line-management system to expedite the traffic flow through those offices. Other initiatives pursued by the Tax Commission include the expanded use of online filing, scanning or image-lifting technology to electronically extract return information, and designing systems so that "data warehousing" of taxpayer information can be accomplished. All of these improvements will provide better tools to assist taxpayers in tax compliance and make the processing and verification of taxpayer information more efficient. Improvements are expected to continue for several more years and until all systems and processes have been reviewed for update. It should be noted that Technology Management employees are now classified as part of the Department of Technology Services workforce. Performance Work Product Universe: The Technology Management Division deals with about 2 million electronically filed documents as well as upkeep and management of the databases related to all 7 million tax returns, payments, and transactions each year. Performance measures for the Technology Management Division are presented within the DTS budget. Click here for the link to the DTS performance measures. Funding Detail In addition to the General Fund, Education Fund, and Sales and Use Tax Administrative Fees Account, the Transportation Fund is a major source of financing for Technology Management. During the 2006 General Session, employees of the Technology Management Divison were transferred from the Tax Commission to the Division of Technology Services. With 74 FTEs, expenditures within the Technology Management Division are largely personnel related. The personnel expenditures (72% of total) are changes related to mainframe operations, LAN, and equipment and software maintenance and operations. Vendor software maintenance is the next largest expenditure component, comprising 24% of the Division's expenditures.
Program: Tax Processing Division Function The Tax Processing Division disseminates tax forms, instructions, and publications to citizens. It collects and records tax payments and taxpayer information, processes paper and electronic tax documents, and maintains archival records. Performance Work Product Universe: In terms of workload, the Processing Division deals with:
Indicative of the Processing Division's accountability is the dates by which all timely-filed income tax returns are entered and checks deposited. Processing completion dates can vary from year to year based upon a number of factors, including the timing of when the majority of the workload is received. In FY 2010, the Processing Division completed returns ahead of the date by which the State would be required to pay interest on returns that are filed accurately and on time. The table below represents the date by which all timely filed returns were entered and checks deposited. In terms of processing documents, the Division was behind by a couple weeks when compared to the previous fiscal year. 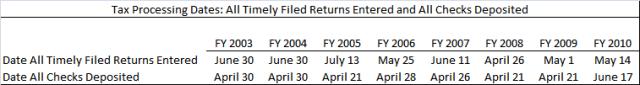 Funding Detail The main funding sources for the Tax Processing Division are the General Fund, Education Fund, Transportation Fund, and Sales and Use Tax Administrative Fees Account. The majority of the Division's expenditures are on personal services and current expense, with postage and mailing making up a large portion (about $2 million in FY 2010 when Tax Processing Division is combined with all other divisions) of current expense. The postage budget decrease in FY 2009 and FY 2010 was largely due to legislatively authorized decreases in the mailing of income tax returns and reminder notices, and down-sizing of the motor vehicle renewal packet. Other large items within the current expense category are: printing of tax forms (3% of total budget), processing equipment maintenance (3% of total budget) and credit card company fees (2% of total budget). The average salary of an employee within this Division is lower than that of most of the other divisions, $14.79 per hour, with an additional $9.58 per hour in benefits. The positions representing the largest portion of the personnel services budget include Accounting Technicians ($2,414,768), Processing Services Technicians ($540,233), Office Technicians ($276,392), and Information Analysts ($254,863). 
Function Seasonal employees are a factor in the efficient operation of the Tax Commission. Commission workloads vary sharply throughout the year. For instance, the Processing Division utilizes temporary employees during high volume document filing periods, such as the spring for income tax returns and each quarter for business tax returns. Funding Detail For the past three years, the Tax Commission was authorized 16 full-time-equivalent seasonal employees. With the intent to increase efficiency, the Legislature authorized a reduction in the size of the seasonal staff by half. On an average annual basis, the budgeted seasonal employee costs $22,195 in wages and $3,052 in benefits. A seasonal employee is not hired for the full year, but rather only for the 2-3 months when the individual is needed. The program is funded by a mix of General Fund, Education Fund, and the Sales and Use Tax Administrative Fees Account.
Function Through outreach and education programs, Tax Payer Services promotes voluntary compliance with Utah tax statutes. Its employees respond to written, phone, or in-person requests from taxpayers, assisting them in resolving tax issues by providing timely and accurate information. They use the case management tools of the new tax systems to help increase collection efficiency. The program also uses the Treasury Offset Program to garnish federal refunds of approximately 6,662 delinquent Utah taxpayers from the following year. The Division also outsources debt collection of accounts that are not in litigation, under a payment agreement, assigned to a collector for active collection, or whose outsourcing would be in violation of state or federal law. Performance Work Product Universe: In terms of workload, the Tax Payer Services Division deals with:
Taxpayer Services considers the ratio of delinquent collections to net accounts receivable as indicative of its performance success. The ratio dropped in FY 2010 from 7.98% to 5.82%. Part of the drop is due to the recession's impact on taxpayers' ability to pay taxes on time. 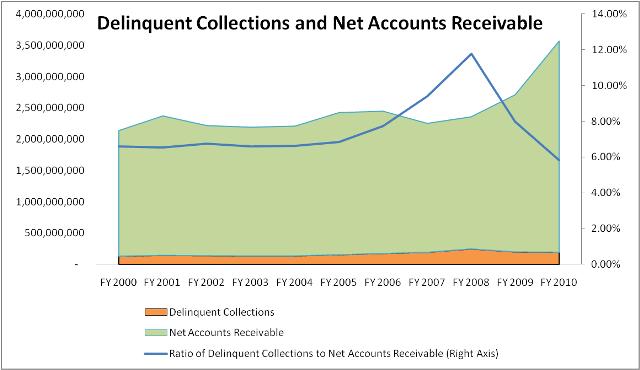 The Divison also tracks the number of delinquent cases cleared to zero. In FY 2010, the Division cleared 97,978, an increase of 39% over the previous fiscal year. The Division thinks the increase seen in FY 2010 is an anomaly, with the Division expecting cleared cases to be closer to that of prior fiscal years in the upcoming two years.  Funding Detail Like many of the other programs under the Tax Commission, the majority of the funding mix for Taxpayer Services is General Fund, Education Fund, and the Sales and Use Tax Administrative Fees Account. In terms of expenditures, the largest items are personnel services (91% of total budget in FY 2010) and current expenses (8% of total budget in FY 2010). The three largest personnel services components are: Compliance Agents & Managers (5,340,304), Problem Resolution Specialists ($1,802,300), and Executive Management & Supervisors ($881,968). The largest expenditure items within current expenses include postage for delinquency notices and billings (5% of total budget), building & grounds OS&M (1% of total budget), ITS telecommunications charges, including the Tax Commission's 1-800 access line (1% of total budget).
Program: Property Tax Division Function The Property Tax Division appraises and audits complex natural resource extraction and transportation related properties in the state, as well as properties that cross county or state lines. Such properties include those owned by airlines, motor carriers, railroads, and utilities. The Division works with local officials to assure equitable and accurate assessment and taxation under local property tax systems. It also administers the Truth-In-Taxation law. Statutory Authority The Utah Constitution, Article XIII, Section 6, Paragraph 3 provides authority for the State Tax Commission to assess, adjust, and equalize property values and to revise local property tax levies when necessary. The Property Tax Division also draws authority from the Property Tax statute contained in Utah Annotated Code Title 59, Chapter 2. Performance Work Product Universe: In terms of work to be managed, the Division completed:
The Property Tax Division considers as indicative of its performance the percentage of centrally assessed companies valued on time. Since FY 2001, this has been consistent at 100%. As indicative of productivity improvement, the Division tracks the number of personal property audits per auditor per year. The number of personal property audits per auditor per year does not consistently increase each year, but the number of personal property audits per auditor per year has increased from 245 in FY 2000 to 314 in FY 2010. 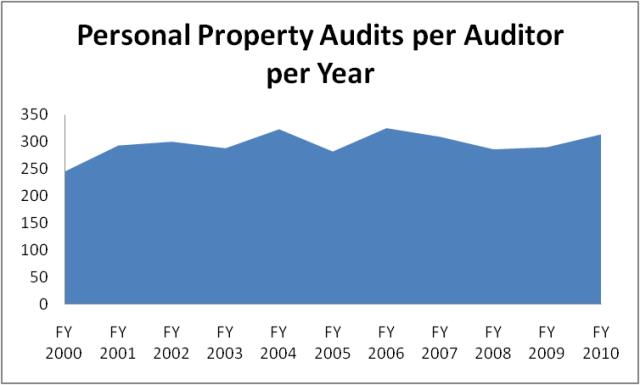 Funding Detail The Property Tax Division's primary financing source is the Education Fund. A portion of funding comes from a dedicated credit property assessment fee authorized by UCA 59-2-703 and 59-2-705. Expenditures within the Property Tax Division comprise personnel services (90%), current expenses (7%), and travel (3%). The top three personnel services areas are: Tax Appraisal Specialists and Managers and Personal Property Appraisers and Managers ($2,707,759), Research Analysts & Consultants ($556,520), and Executive Management ($481,819). The largest current expenditures within the current expense accounting include rent of motor pool vehicles for field work (1% of total budget) and building & grounds (1% of total budget). The travel budget comprised hotel and other expenses related to visiting local property tax officials.
Function The Division of Motor Vehicles (DMV) administers statewide vehicle title, registration, and related functions. It implements motor vehicle policy and procedure and helps maintain the State's motor vehicle computer system. Also, the DMV provides training to all computer users, manages a telephone section for statewide assistance, and manages vehicle-related appeals. Additionally, the DMV administers the International Registration Plan and the International Fuel Tax Administration Plan. Utah Code 59-2-406 authorizes the Tax Commission to contract with county governments, at the counties' option, to provide local customer services for the combined collection of the county's fee-in-lieu and Title 41 Motor Vehicle Fees. Several counties have elected to retain those functions. Fees for the reciprocal services provided between the State and counties are established in statute. Subsection 406 (3) sets the reimbursement fee and instructs that an adjustment be made each year based on the prior year's consumer price index change. The approval and reimbursement of fees are made by the Legislature. Statutory Authority Utah Annotated Code Title 41 covers the State's motor vehicle laws. Title 41, Chapter 1a is the primary section adminstered by the Motor Vehicle Division, which includes registration requirements and motor vehicle fees. The Motor Vehicle Division also draws authority from Title 41, Chapter 22 to administer Off-Highway vehicle registration requirements, and Title 73, Chapter 18 to administer Boat Registration and Fee requirements. Performance Work Product Universe: In terms of work to be managed, the Motor Vehicle Division deals with:
Although largely dependent upon the demand side, the Division tracks internet renewals and considers the increasing use of internet and on-the-spot transactions as indicative of its effort to improve efficiency. The number of internet renewals has grown from 67,534 in FY 2001 to 614,475 in FY 2010 and the number of on-the-spot transactions has grown from 9,062 in FY 2001 to 452,379 in FY 2010. 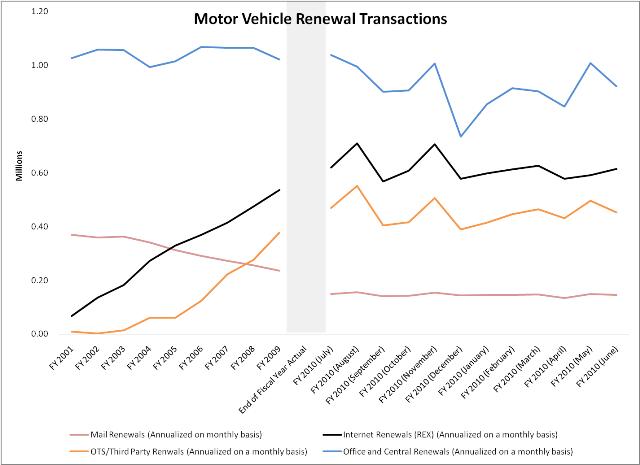 Funding Detail In addition to the General Fund and Transportation Fund, dedicated credit revenue makes up a large portion of the Division's funding. The two largest dedicated credit sources are property assessment fees and electronic payment fees, which totaled about $2.3 million and $4.8 million, respectively, in FY 2010. Expenditures within the Motor Vehicle Division are largely composed of salary and benefits (54% of FY 2010 expenditures) and current expenses (45% of FY 2010 expenditures). The three largest personnel services areas are: Motor Vehicle Technicians ($6,829,089), Supervisors ($1,565,203), and Seasonal Positions ($469,581). The largest expenditure items within the current expense category are electronic transaction and electronic payment costs (25% of total budget), contractual services for payments to counties that have chosen to do state motor vehicle work (6% of total budget), postage for renewal notices and mailing out decals (4% of total budget), and rent of land and buildings (3% of total budget).
Program: Motor Vehicle Enforcement Division Function The Motor Vehicle Enforcement Division (MVED) protects Utah citizens from motor vehicle fraud and attempts to foster a healthy motor vehicle sales environment. Officer duties include title, odometer and motor vehicle dealer fraud investigations, regulatory licensing enforcement, VIN inspections, registration enforcement, and investigation of consumer complaints against licensed dealers, commercial auto theft, and salvage vehicle fraud. Statutory Authority Utah Annotated Code Title 41 covers the State's motor vehicle laws. Title 41, Chapter 3 is the primary section adminstered by the MVED. The Chapter specifies motor vehicle business regulations. Performance Work Product Universe: In terms of work to be managed, the Motor Vehicle Enforcement Division deals with:
The Division tracks the total number of motor vehicle crime investigations each year in order to assess the work load and output of investigative staff. The number of crime investigations in FY 2010 declined to 2,500 from 2,725 in FY 2009. This is below the ten year average of 2,599. Each year, MVED officers recover more stolen vehicles than other law enforcement officers because of an emphasis on vehicle enforcement. The following graph shows the number of stolen vehicles recovered over time. In FY 2010, the number of recovered stolen vehicles was 451, a decrease of 20% when compared to FY 2009 count of recovered stolen vehicles. 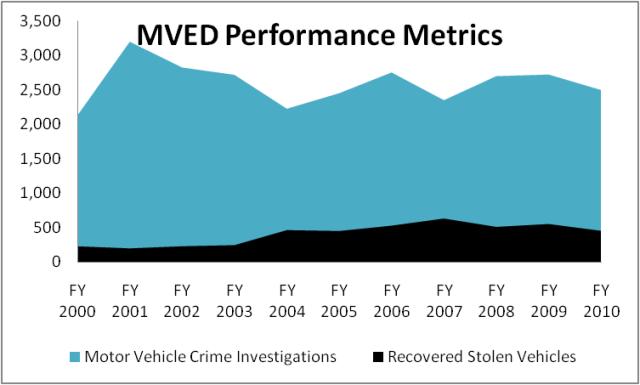 Some other performance measures are given below.
Funding Detail The greatest portion of the Motor Vehicle Enforcement Division's funding is in the form of dedicated credits. Of all division dedicated credits, the temporary permit fee generates the greatest revenue, about $2.3 million in FY 2009. Senate Bill 106 of the 2007 General Session removed the temporary permit fee from statute. The Motor Vehicle Enforcement Division is now authorized to request of the Legislature modification of this fee in the budget process to cover division cost increases including compensation package costs. During the 2009 General Session, the Legislature authorized this fee to increase from $8 per transaction to $12.
|