Agency: USTAR Line Item: USTAR Background The USTAR line item comprises expenditures for USTAR Administration, Technology Outreach, and Research Teams.
Funding Detail | Sources of Finance | 2008
Actual | 2009
Actual | 2010
Actual | 2011
Actual | 2012
Approp | | General Fund | $19,324,500 | $16,397,800 | $15,296,100 | $14,501,300 | $13,952,700 | | General Fund, One-time | $0 | ($1,947,700) | ($5,072,900) | $0 | $0 | | Federal Funds | $0 | $0 | $0 | $1,654,200 | $0 | | American Recovery and Reinvestment Act | $0 | $0 | $15,884,400 | $15,461,400 | $540,500 | | Dedicated Credits Revenue | $0 | $6,300 | $9,600 | $4,800 | $26,400 | | Beginning Nonlapsing | $9,286,300 | $11,269,700 | $12,165,000 | $16,744,900 | $12,966,000 | | Closing Nonlapsing | ($11,269,600) | ($12,165,000) | ($16,744,900) | ($21,702,000) | ($1,777,800) | | Total | $17,341,200 | $13,561,100 | $21,537,300 | $26,664,600 | $25,707,800 |
|---|
| | Programs: | 2008
Actual | 2009
Actual | 2010
Actual | 2011
Actual | 2012
Approp | | Administration | $239,700 | $936,400 | $899,600 | $825,400 | $784,900 | | Technology Outreach | $2,816,600 | $2,571,200 | $2,001,400 | $2,770,500 | $1,951,800 | | Research Teams | $14,284,900 | $10,053,500 | $18,636,300 | $23,068,700 | $22,971,100 | | Total | $17,341,200 | $13,561,100 | $21,537,300 | $26,664,600 | $25,707,800 |
|---|
| | Categories of Expenditure | 2008
Actual | 2009
Actual | 2010
Actual | 2011
Actual | 2012
Approp | | Personnel Services | $1,546,600 | $2,030,400 | $1,587,800 | $1,638,800 | $1,824,400 | | In-state Travel | $35,300 | $36,400 | $22,100 | $18,500 | $24,000 | | Out-of-state Travel | $20,400 | $22,500 | $19,900 | $15,800 | $18,700 | | Current Expense | $15,491,400 | $1,015,900 | $769,400 | $737,900 | $810,500 | | DP Current Expense | $196,300 | $152,400 | $132,400 | $71,800 | $59,100 | | DP Capital Outlay | $51,200 | $0 | $0 | $0 | $0 | | Other Charges/Pass Thru | $0 | $10,303,500 | $19,005,700 | $24,181,800 | $22,971,100 | | Total | $17,341,200 | $13,561,100 | $21,537,300 | $26,664,600 | $25,707,800 |
|---|
| | Other Indicators | 2008
Actual | 2009
Actual | 2010
Actual | 2011
Actual | 2012
Approp | | Budgeted FTE | 13.0 | 26.8 | 26.0 | 26.0 | 26.0 | | Actual FTE | 0.0 | 0.0 | 22.6 | 22.2 | 0.0 |
|
|
|
|
|
|
Subcommittee Table of ContentsProgram: Administration Function The USTAR Executive Director is responsible for day-to-day administration and provides staff support to the Governing Authority, which manages all of the components of the initiative. The Administration is broken up into centralized marketing, human resources, accounting, payroll, purchasing, and network support. The collaboration resources the Administration provides includes a centralized database of stakeholder and client information, on a Salesforce platform, as well as online resources such as the www.innovationutah.com website and electronic e-Connections newsletter. Statutory Authority UCA 63M-2-302 specifies the duties of the Governing Authority. The authority: - Ensures that funds appropriated and received for research and development at the research universities and for the technology outreach program are used appropriately, effectively, and efficiently in accordance with the intent of the Legislature;
- Works with the administrations of the University of Utah and Utah State University to expand key research;
- Encourages and enhances technology transfer and commercialization of research and technologies developed at the research universities to create high-quality jobs and new industries in the private sector in Utah;
- Reviews state and local economic development plans and appropriations to ensure that the project and appropriations do not duplicate existing or planned programs;
- Establishes economic development objectives for the project;
- Makes rules for allocating monies appropriated for research teams and for the commercialization of new technology between Utah State University and the University of Utah;
- Verifies that the USTAR project is being enhanced by research grants and that it is meeting economic development objectives;
- Monitors all research plans that are part of the project at the research universities to determine that appropriations are being spent in accordance with legislative intent and to maximize the benefit and return to the State;
- Develops methods and incentives to encourage investment in and contributions to the USTAR project from the private sector; and
- Annually reports and makes recommendations to the Governor and the Economic Development and Revenue Subcommittee.
Performance Measures the Administration Division considers indicative of its success are the number of website hits, accounts in SalesForce.com, and media stories mentioning USTAR. The number of website hits increased 17% over the previous fiscal year to an average of 5,376 per month. Total accounts in SalesForce.com increased to 2,812 in FY 2011, an increase of 7% over FY 2010. In FY 2011, USTAR saw a substantial 80% increase in Media stories mentioning the USTAR, reaching 130 per month. 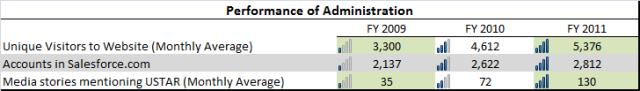 Funding Detail Personnel services is currently USTAR Administration's largest category of expenditure at $542,400. This category includes the wages and benefits of the USTAR executive director and his staff. The three largest current expense items in FY 2011 were: Advertising & Legal Publications ($118,900), Rental of Land & Buildings ($32,300), and Insurance & Bonds ($23,100). | Sources of Finance | 2008
Actual | 2009
Actual | 2010
Actual | 2011
Actual | 2012
Approp | | General Fund | $270,000 | $672,200 | $676,100 | $185,000 | $668,500 | | General Fund, One-time | $0 | ($672,200) | ($15,900) | $0 | $0 | | American Recovery and Reinvestment Act | $0 | $0 | $523,500 | $492,100 | $0 | | Beginning Nonlapsing | $24,200 | $936,400 | $0 | $284,100 | $116,400 | | Closing Nonlapsing | ($54,500) | $0 | ($284,100) | ($135,800) | $0 | | Total | $239,700 | $936,400 | $899,600 | $825,400 | $784,900 |
|---|
| | Categories of Expenditure | 2008
Actual | 2009
Actual | 2010
Actual | 2011
Actual | 2012
Approp | | Personnel Services | $225,000 | $550,100 | $524,100 | $542,400 | $497,300 | | In-state Travel | $1,400 | $2,700 | $1,400 | $2,500 | $1,500 | | Out-of-state Travel | $2,100 | $6,700 | $6,000 | $4,800 | $4,200 | | Current Expense | $7,300 | $279,000 | $288,100 | $225,800 | $239,800 | | DP Current Expense | $3,900 | $97,900 | $80,000 | $49,900 | $42,100 | | Total | $239,700 | $936,400 | $899,600 | $825,400 | $784,900 |
|---|
| | Other Indicators | 2008
Actual | 2009
Actual | 2010
Actual | 2011
Actual | 2012
Approp | | Budgeted FTE | 2.0 | 6.0 | 6.0 | 6.0 | 6.0 | | Actual FTE | 0.0 | 0.0 | 5.7 | 5.8 | 0.0 |
|
|
|
|
|
|
Subcommittee Table of ContentsProgram: Technology Outreach Function The USTAR Technology Outreach and Innovation Program (TOIP) connects USTAR research and technologies to regional colleges, universities, businesses, and entrepreneurs and encourages local commercialization of these technologies. As of October 2011, the Governing Authority has established: - A virtual innovation network
- Four outreach centers: Southern Utah University and Dixie State University co-location, Utah Valley State College, Weber State University, and the Utah State University Extension in the Uintah Basin
- A presence in the Small Business Innovation Research (SBIR) and Science Technology Transfer and Research (STTR) Assistance Center at Salt Lake Community College (SBIR-STTR Resource Center)
- Support to the Cluster Acceleration Project (UCAP) and Bioinnovations Gateway (BiG)
- Support for "Concept to Company" competitions
- Technology Outreach Program directors, and hired analysts and interns to work with local companies, entrepreneurs, the universities, and regional stakeholders to increase commercialization activities.
Statutory Authority The scope of the USTAR Technology Outreach Program is outlined in UCA 63M-2-202. The program: - Brokers ideas, new technologies, and services to entrepreneurs and businesses throughout a defined service area;
- Engages local entrepreneurs and professors at applied technology centers, colleges, and universities by connecting them to Utah's research universities;
- Screens business ideas and new technologies to ensure that the ones with the highest growth potential receive the most targeted services and attention;
- Connects market ideas and technologies in new or existing businesses or industries or in regional colleges and universities with the expertise of Utah's research universities;
- Assists businesses, applied technology centers, colleges, and universities in developing commercial applications for their research; and
- Disseminates discoveries and technologies originating at Utah's research universities to local entrepreneurs, businesses, applied technology centers, colleges, and universities.
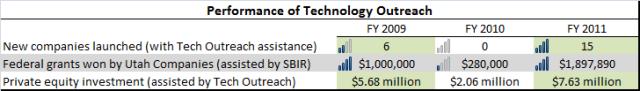
Performance In FY 2011, TOIP pursued 243 projects, of which 193 were completed and 50 are in progress. These regional initiatives included:
- Helping entrepreneurs raise more than $7.63 million in private equity investment;
- Supporting the BioInnovations Gateway (BiG) and Southern Utah Information Technology and renewable Energy incubators (IRTE). BiG currently has four clients in residence and IRTE has two;
- Significant support to Utah Cluster Acceleration Partnership (UCAP) projects;
- Worked with clients at its SBIR center and assisted 19 clients with grant submissions, resulting in six SBIR "wins" totaling about $1.9 million in grant funding.
Other performance indicators for FY 2010 and FY 2011 include:
- The Technology Commercialization Grants Program (TCG)supported 87 projects with seed funding and consulting;
- Since inception, TCG recipients have filed 73 patent or disclosure applications, created 72 prototypes, signed 37 new sales distribution agreements, and assisted TCG awardees in closing $7.9 million in private capital.
 Funding Detail Personnel services for FY 2011 totaled $1,096,400. In FY 2011 current expenses totaled $512,100. The top five current expense categories were: Non-Medical Contractual Services ($426,300), Rental of Land & Buildings ($36,500), Rental of Motor Pool Vehicles ($8,200), Wireless Communication Service ($8,000), and Conventions, Seminars, Workshops & Committees ($5,600). | Sources of Finance | 2008
Actual | 2009
Actual | 2010
Actual | 2011
Actual | 2012
Approp | | General Fund | $4,054,500 | $2,225,600 | $1,120,000 | $1,608,700 | $1,117,100 | | General Fund, One-time | $0 | ($2,225,600) | $0 | $0 | $0 | | Federal Funds | $0 | $0 | $0 | $1,654,200 | $0 | | American Recovery and Reinvestment Act | $0 | $0 | $1,330,200 | $0 | $0 | | Dedicated Credits Revenue | $0 | $6,300 | $9,600 | $4,800 | $26,400 | | Beginning Nonlapsing | $3,553,700 | $2,564,900 | $373,500 | $831,900 | $808,300 | | Closing Nonlapsing | ($4,791,600) | $0 | ($831,900) | ($1,329,100) | $0 | | Total | $2,816,600 | $2,571,200 | $2,001,400 | $2,770,500 | $1,951,800 |
|---|
| | Categories of Expenditure | 2008
Actual | 2009
Actual | 2010
Actual | 2011
Actual | 2012
Approp | | Personnel Services | $1,321,600 | $1,480,300 | $1,063,700 | $1,096,400 | $1,327,100 | | In-state Travel | $33,900 | $33,700 | $20,700 | $16,000 | $22,500 | | Out-of-state Travel | $18,300 | $15,800 | $13,900 | $11,000 | $14,500 | | Current Expense | $1,199,200 | $736,900 | $481,300 | $512,100 | $570,700 | | DP Current Expense | $192,400 | $54,500 | $52,400 | $21,900 | $17,000 | | DP Capital Outlay | $51,200 | $0 | $0 | $0 | $0 | | Other Charges/Pass Thru | $0 | $250,000 | $369,400 | $1,113,100 | $0 | | Total | $2,816,600 | $2,571,200 | $2,001,400 | $2,770,500 | $1,951,800 |
|---|
| | Other Indicators | 2008
Actual | 2009
Actual | 2010
Actual | 2011
Actual | 2012
Approp | | Budgeted FTE | 11.0 | 20.8 | 20.0 | 20.0 | 20.0 | | Actual FTE | 0.0 | 0.0 | 16.9 | 16.4 | 0.0 |
|
|
|
|
|
|
Subcommittee Table of ContentsProgram: Research Teams Function The USTAR Governing Authority is to allocate funds to Utah State University and the University of Utah to fund science and technology research by USTAR scientists. The researchers and the research focus areas are to:
- Build on existing university strengths;
- Create commercialization opportunities;
- Target strategic markets;
- Leverage Utah industry strengths.
To date, the two research universities have 20 active teams. The areas of expertise are:Energy Innovation Focus Area - Biofuels
- Fossil Energy: Carbon Sequstration
- Brian McPherson, John Mclennan, and Manmorangam Misra
- Intuitive Buildings
- Energy Initiative
- Alternative Energy
Nanotechnology Innovation Focus Area - Wireless Nanosystems
- Carlos Mastrangelo, Massood Tabib-Azar, Darrin Young, and Gianluca Lazzi
- Nanotechnology Biosensors
- Marc Porter, Ling Zang, and Jaimee Zang
- Micro & Nano Systems Integration
- Rajesh Menon and Hanseup Kim
Medical Imaging and Brain Medicine Innovation Focus Area - Circuits of the Brain
- Julie Korenberg and Li Dai
- Diagnostic Imaging
- Perry Renshaw, Deborah Yurgelun-Todd, Melissa Lopez-Larson, Andrew Prescot, Doug Kondo, and EK Jeong
- Nanoscale & Biomedical Photonic Imaging
- Saveez Saffarian, Ayoko Yamaguchi, Matt Wachoviak, and Mark Ji
BioDevice and BioPharma Innovation Focus Area - Biomedical Device Innovation
- John White, Hamidreza Ghandehari, and Alan Dorval
- Applied Nutrition Research
- David York, Michael Lefevre, and Stephane Boghossian
- Genomic Medicine
- Synthetic Biomanufacturing
- Randy Lewis and Foster Agblevor
- Veterinary Disease/Diagnostics
Imaging Technology and Digital Media Innovation Focus Area- Imaging Technology
- Guido Gerig, Tolga Tasdizen, P. Thomas Fletcher, and Orly Alter
- Advanced Sensing & Imaging
- Space Weather
- Tobiska and Herbert Carlson
- Digital Media
Statutory Authority UCA 63M-2-203 directs the USTAR Governing Authority to allocate monies to Utah State University and the University of Utah to fund science and technology research by USTAR scientists. Performance External research grants amounted to $28,476,734 in FY 2011, an increase of 38% over the previous fiscal year. Patents filed increased by 15 from FY 2011 over FY 2010. The number of researchers hired (cumulative) at the end of FY 2011 was 44, an increase of 8 over the previous fiscal year and the number of FTEs associated with the main researchers amounted to 189 at the end of FY 2011, an increase of 2% over the FY 2010 count. 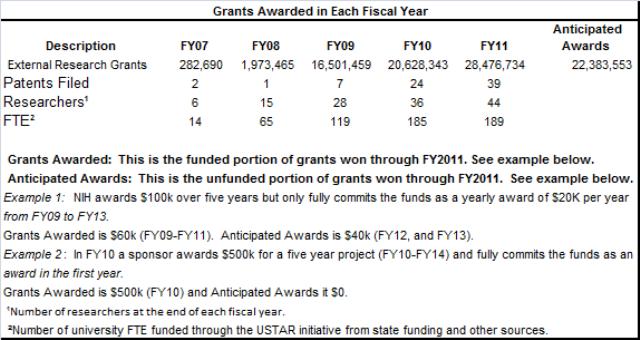 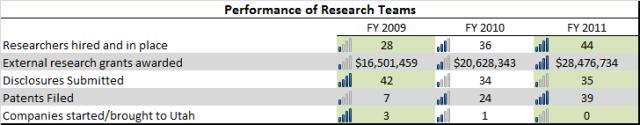 Funding Detail State funding for the research teams is an ongoing General Fund appropriation of $12.2 million. S.B. 240 of the 2009 General Session allocated $33 million from the governor's flexible allocation of Federal ARRA funding for research expenses. Most of the ARRA funding went to the research teams and was received in FY 2010 and FY 2011. Although specific details have not been reported, most of the pass-thru funding to the universities covers the personnel expenditures of the researchers and their staff. The funding also covers ongoing maintenance of the labs, buildings, and equipment. USTAR is using the closing nonlapsing in FY 2011 to cover ongoing expenditures in FY 2012. | Sources of Finance | 2008
Actual | 2009
Actual | 2010
Actual | 2011
Actual | 2012
Approp | | General Fund | $15,000,000 | $13,500,000 | $13,500,000 | $12,707,600 | $12,167,100 | | General Fund, One-time | $0 | $950,100 | ($5,057,000) | $0 | $0 | | American Recovery and Reinvestment Act | $0 | $0 | $14,030,700 | $14,969,300 | $540,500 | | Beginning Nonlapsing | $5,708,400 | $7,768,400 | $11,791,500 | $15,628,900 | $12,041,300 | | Closing Nonlapsing | ($6,423,500) | ($12,165,000) | ($15,628,900) | ($20,237,100) | ($1,777,800) | | Total | $14,284,900 | $10,053,500 | $18,636,300 | $23,068,700 | $22,971,100 |
|---|
| | Categories of Expenditure | 2008
Actual | 2009
Actual | 2010
Actual | 2011
Actual | 2012
Approp | | Current Expense | $14,284,900 | $0 | $0 | $0 | $0 | | Other Charges/Pass Thru | $0 | $10,053,500 | $18,636,300 | $23,068,700 | $22,971,100 | | Total | $14,284,900 | $10,053,500 | $18,636,300 | $23,068,700 | $22,971,100 |
|---|
Subcommittee Table of Contents |