Compendium of Budget Information for the 2012 General Session
| Business, Economic Development, & Labor Appropriations Subcommittee | |||||||||||||||||||||||||||||||||||||||||||||||||||||||||||||||||||||||||||||||||||||||||||||||||||||||||||||||||||||||||||||||||||||||||||||||||||||||||||||||||||||||||||||||||||||||||||||||||||||||||||||||||||||||||||||||||||||||||||||||||||||||||||||||||||||||||||||||||||||||||||||||||||||||||||||||||||||||||||||||||||||||||||||||||||||||||||||||||||||||||||||||||||||||||||||||||||||||||||||||||||||||||||||||||||||||||||||||||||||||||||||||||||||||||||||||||||||||||||||||||||||||||||||||||||||||||||||||||||||||||||||||||||||||||||||||||||||||||||||||||||||||||||||||||||||||||||||||||||||||||||||||||||||||||||||||||||||||||||||||||||||||||||||||||||||||||||||||||||||||||||||||||||||||||||||||||||||||||||||||||||||||||||||||||||||||||||||||||||||||||||||||||||||||||||||||||||||||||||||||||||||||||||||||||||||||||||||||||||||||||||||||||||||||||||||||||||||||||||||||||||||||||||||||||||||||||||||||||||||||||||||||||||||||||||||||||||||||||||||||||||||||||||||||||||||||||||||||||||||||
| Subcommittee Table of Contents | |||||||||||||||||||||||||||||||||||||||||||||||||||||||||||||||||||||||||||||||||||||||||||||||||||||||||||||||||||||||||||||||||||||||||||||||||||||||||||||||||||||||||||||||||||||||||||||||||||||||||||||||||||||||||||||||||||||||||||||||||||||||||||||||||||||||||||||||||||||||||||||||||||||||||||||||||||||||||||||||||||||||||||||||||||||||||||||||||||||||||||||||||||||||||||||||||||||||||||||||||||||||||||||||||||||||||||||||||||||||||||||||||||||||||||||||||||||||||||||||||||||||||||||||||||||||||||||||||||||||||||||||||||||||||||||||||||||||||||||||||||||||||||||||||||||||||||||||||||||||||||||||||||||||||||||||||||||||||||||||||||||||||||||||||||||||||||||||||||||||||||||||||||||||||||||||||||||||||||||||||||||||||||||||||||||||||||||||||||||||||||||||||||||||||||||||||||||||||||||||||||||||||||||||||||||||||||||||||||||||||||||||||||||||||||||||||||||||||||||||||||||||||||||||||||||||||||||||||||||||||||||||||||||||||||||||||||||||||||||||||||||||||||||||||||||||||||||||||||||||
Background The Tax Administration line item includes 10 program areas: Tax Administration, Auditing Division, Multi-State Tax Compact, Technology Management(DTS), Processing Division, Seasonal Employees, Tax Payer Services, Property Tax, Motor Vehicles, and the Motor Vehicle Enforcement Division. Intent Language Under Section 63J-1-603 of the Utah Code the Legislature intends that $72,046,600 appropriations provided for the Utah State Tax Commission in Item 71 Chapter 2, Laws of Utah not lapse at the close of Fiscal Year 2011. The use of any nonlapsing funds is limited to the costs directly related to the modernization of tax and motor vehicle systems and processes. Under Section 63J-1-603 of the Utah Code the Legislature intends that Electronic Payment Fees appropriations provided for the Utah State Tax Commission in Item 71 Chapter 2, Laws of Utah not lapse at the close of Fiscal Year 2011. The use of any nonlapsing funds is limited to covering costs related to electronic payments. Funding Detail
Program: Administration Division Function The Administration Division includes the Commissioners' and the Executive Director's Offices. Both offices provide direction and management to the Department. The Commissioners' Office:
The Executive Director's section:
Performance Some indications of the success of the Administration Division include successful oversight of the tax system implementation process, timely distribution of revenue, and training hours provided. The Office also seeks to reduce the time required for appeals; since FY 2001, the cleared appeals has ranged from a low of 1,707 to a high of 3,441. In FY 2011, the Division finalized 3,269 appeals. 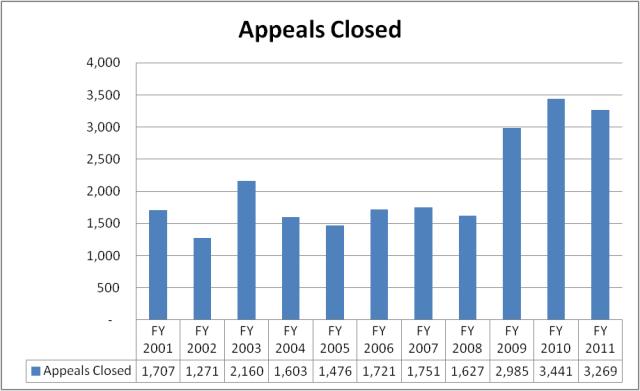 Funding Detail The Administration Division is funded primarily from General Fund and Education Fund. It also has the funds that are related to the long-term project of modernizing the agency's tax and motor vehicle systems. In FY 2011, 69% of the division's costs were for personal services needed to provide administrative direction, oversight, financial accounting of the state and local revenues and distributions, division and system support services, and the taxpayer adjudication process. Current expenses total 14%, with the largest category being the payment of agency human resource and payroll services to the State Department of Human Resource Management. Data Processing Capital was 14% of the division's expenses related to the agency's ongoing computer system modernization project.
Function The Auditing Division attempts to increase voluntary and involuntary taxpayer compliance through selective examination of taxpayer returns and supporting records. The Division audits all taxes except property tax (local level), and conducts audits in-house and at taxpayers' places of business. The Division emphasizes compliance audits for accurate tax return reporting, and review for possible investigation of suspected fraud and tax evasion. Through educational outreach and customer service, the Division works to help taxpayers report future taxes properly. Performance The coverage areas for the Auditing Division include about 1.2 million income tax returns and about another 0.8 million business returns. The following chart details audit satisfaction on a scale from one to five. A rating of five indicates the taxpayer "strongly agrees" with the statement, "overall, I was satisfied with the manner in which the audit was conducted," and a rating of one means the taxpayer "strongly disagrees" with the statement. Over the past ten years, the Division has consistently maintained a rating between four and five. 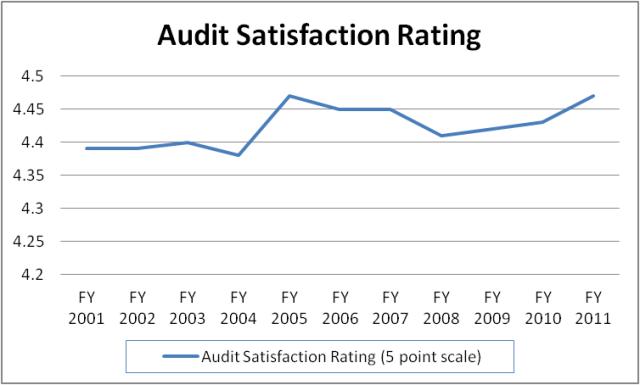 The Auditing Division also considers indicative of its success the number of new accounts discovered (sales and corporate) from auditing activities. The chart that follows represents new accounts discovered from FY 2006 to FY 2011. 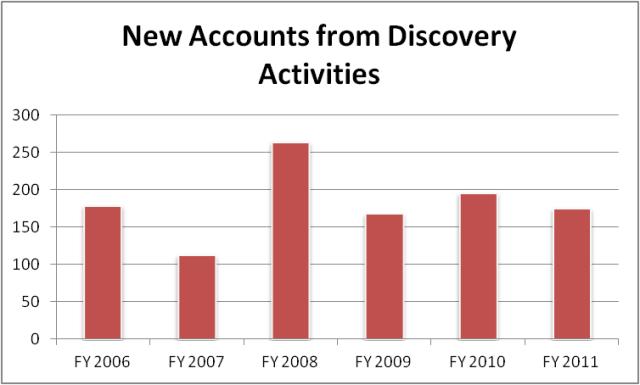 Another measurement of performance success is whether the number of income tax audits performed is increasing. The table below represents indexes of the number of income tax audits performed and the hours spent on income tax. The number of individual income tax audits performed is up 20% over FY 2010. 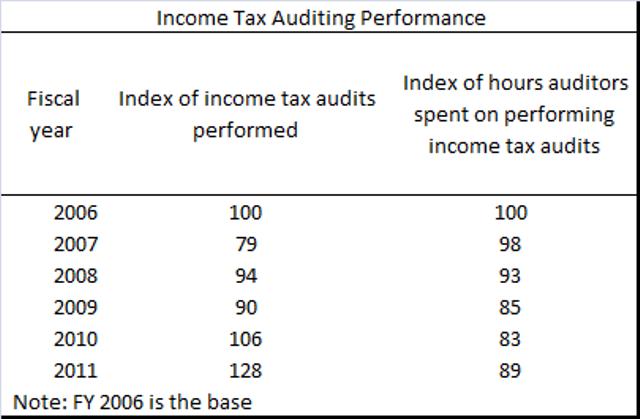 Funding Detail The Auditing Division is funded mostly from the General Fund, the Education Fund, and the Tax Commission Administrative Charge Restricted Account. In FY 2011, and in relation to the auditing division's overall budget, 92% of costs were for personnel, mostly auditors and audit support functions. Travel costs related to audits both in-state and out-of-state comprised almost 4% of the divisions budget. Current expenses for the audit function was approximately 4%. The largest expenditure item within the current expense category is building & grounds office supply and maintenance, at 1% of the division's overall budget.
Program: Multi-State Tax Compact Function The Multi-State Tax Compact (MTC) is a group of state governments working together to help make state tax systems fair, effective, and efficient for interstate and international commerce. It is also an effort to protect state tax sovereignty. The Compact's two primary projects are the Joint Audit Program and the National Nexus Program. The Joint Audit Program reviews a business' sales and corporate income tax filings for several states at the same time. Accordingly, the audit program encourages compliance with state tax laws, generates tax revenues for states, contributes to uniformity in taxpayer treatment, and helps states learn about new industry conditions and circumstances. The National Nexus Program encourages voluntary disclosure and discovers businesses that are not filing returns with states. The Nexus program facilitates an exchange of information between states to identify business reporting or filing inconsistencies among these states. The Tax Commission utilizes the work of the MTC in that assessments from MTC audits amounted to $1.4 million in FY 2008, $3.9 million in FY 2009, $2.5 million in FY 2010, and $2.4 million in FY 2011. Statutory Authority Although the State is not required to be a member of the MTC, Utah Annotated Code Title 59, Chapter 1, Section 801 shows that the Legislature enacted into law Utah's participation in this compact. Funding Detail Funding for the Multi-State Tax Compact is from the General Fund, the Education Fund, and the Tax Commission Administrative Charge Restricted Account. Annual expenditures represent membership dues to the Multi-State Tax Compact and multi-state audit services that are provided by that organization.
Program: Technology Management Function The Department of Technology Services (DTS) now operates and maintains the Tax Commission's automated systems. It also develops and installs new automated systems to meet specialized demands. In addition, DTS provides service to internal customers through a system-wide 'help desk.' Background The Tax Commission continues to modernize tax and motor vehicle systems and processes. New funding to replace the state's core tax systems was initiated in 2006 with a one-time appropriation of $7 million to DTS. During the 2007 General Session, project funding included $5 million as part of the total payment towards replacing the existing system, and during the 2008 General Session another $6 million was appropriated for the project. The total vendor cost to replace the existing core systems is $22.5 million, with $4.5 million of this stemming from savings from other areas of the Tax Commission's appropriations. This project has included the replacement of the automated systems used to process, record, and distribute sales tax, income tax, employer withholding tax, corporate tax, motor and special fuel taxes, and other miscellaneous taxes. Chronology of Implementation:
The remaining taxes and the motor vehicle functions will be updated in phases over the next two years Other initiatives pursued by the Tax Commission include the expanded use of online filing, scanning or image-lifting technology to electronically extract return information, and designing systems so that "data warehousing" of taxpayer information can be accomplished. Strategic use of new technologies allows the agency to improve its processes and assists in providing quality customer service to taxpayers and vehicle owners. All of these improvements will provide better tools to assist taxpayers in tax compliance and make the processing and verification of taxpayer information more efficient. Improvements are expected to continue for several more years and until all systems and processes have been reviewed for update. It should be noted that Technology Management employees are now classified as part of the Department of Technology Services workforce. Performance The Technology Management Division deals with systems that handle over 2 million electronically filed documents, as well as upkeep and management of the databases related to over 7 million tax returns, payments, and transactions each year. Performance measures for the Technology Management Division are presented within the DTS budget. Click here for the link to the DTS performance measures. Funding Detail The Technology Management Division is funded from 4 primary sources, the General Fund, Education Fund, Transportation Fund and the Tax Commission Administrative Charge Restricted Account. In FY 2011, 99% of the division expenses were categorized as Data Processing costs. These costs include charges from DTS for help desk support, computer security and wide area network connections (26%). It also includes the cost of DTS programmers who assist in development, maintenance and support of agency computer programs (46%). It also includes software licensing and maintenance costs paid to vendors (24%).
Program: Tax Processing Division Function The Tax Processing Division designs and produces tax forms, instructions, and publications for taxpayer use. It collects and records tax payments and taxpayer information, processes paper and electronic tax documents, and maintains archival records. This division is using updated technologies provided by new systems to image documents. Copies of returns, payments, and correspondence can now be accessed in real time, as compared to the prior microfilm and manual retrieval process. Performance In terms of workload, the Processing Division deals with:
Indicative of the Processing Division's accountability is the dates by which all timely-filed income tax returns are entered and checks deposited. Processing completion dates can vary from year to year based upon a number of factors, including the timing of when the majority of the workload is received. In FY 2011, the Processing Division processed returns ahead of the date by which the State would be required to pay interest on returns that are filed accurately and on time. The table below represents the date by which all timely filed returns were entered and checks deposited. 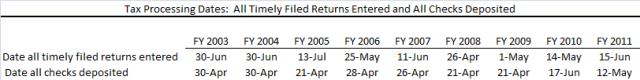 Funding Detail The Processing Division is funded by the General Fund, Education Fund, Transportation Fund, and the Tax Commission Administrative Charge Restricted Account. Personnel costs make up 76% of the Division's expenditures. Current expenses account for 22% of the division's budget. The largest current expenses include postage, printing, credit card processing fees charged by vendors, building costs paid to DFCM, and processing equipment.
Function Seasonal employees are a factor in the efficient operation of the Tax Commission. Commission workloads vary sharply throughout the year. For instance, the Processing Division utilizes temporary employees during high volume document filing periods, such as the spring for income tax returns and each quarter for business tax returns. Funding Detail The seasonal budget is primarily comprised of General Funds and Education Funds. 100% of this budget goes to hiring temporary employees during the peak income tax processing period (around April 15th). On an average annual basis, the budgeted seasonal employee costs $22,195 in wages and $3,052 in benefits.
Function Through outreach and education programs, Tax Payer Services promotes voluntary compliance with Utah tax statutes. Its employees respond to written, phone, or in-person requests from taxpayers, assisting them in meeting their requirements and in resolving tax issues by providing timely and accurate information. The program also uses the Treasury Offset Program to garnish federal refunds of delinquent Utah taxpayers from the following year. The Division also outsources debt collection of accounts that are not in litigation, under a payment agreement, assigned to a collector for active collection, or whose outsourcing would be in violation of state or federal law. Performance In terms of workload, the Tax Payer Services Division deals with:
Taxpayer Services considers the ratio of delinquent collections to average collectible accounts receivable as indicative of its performance success. $313,810,228 in delinquent collections in FY 2011 represent a 5.3% increase from FY 2010. In FY 2011 collectible accounts receivable increased 8%. Part of the increase is due to the recession's impact on taxpayers' ability to pay taxes on time. .jpg) The Delinquent Dollar Collected Turnover Ratio (DDCT) dropped in FY 2011 to 1, from 1.06 in FY 2010. The chart below shows this drop in correlation with the delinquent collections amount since FY 2007. A higher number indicates increased taxpayer ability to pay delinquent tax balances due. In FY 2011 Tax Payer Services saw its greatest amount of delinquent collections and it lowest DDCT ratio in five years. A lower ratio would seem to indicate a lower delinquent collections amount. This occurrence can be traced to the fact that while collections are at their highest level in five years, so to are the total receivables. Total receivables have grown at a faster pace due to the poor economy, reflecting taxpayers' inability to pay. 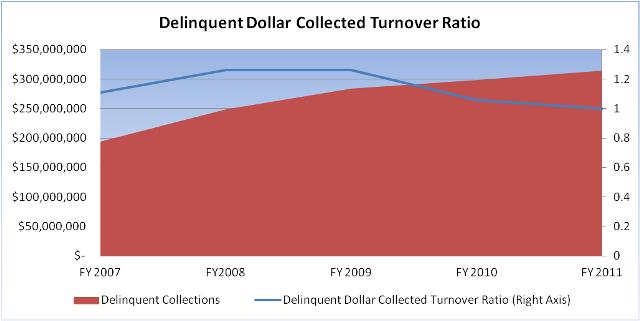 The Divison also tracks the number of delinquent cases cleared to zero. In FY 2011, the Division cleared 92,669, a decrease of 5% from the previous fiscal year. 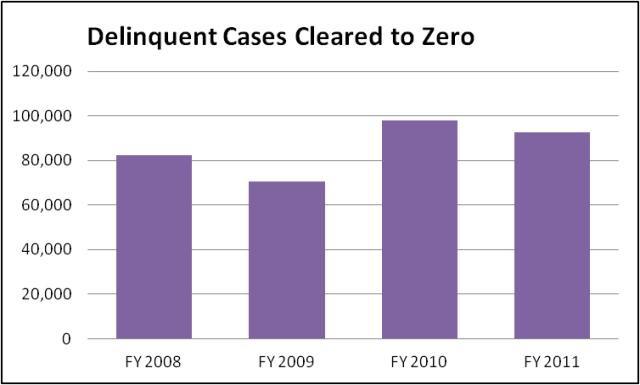 Funding Detail The Taxpayer Services Division is funded primarily with General Fund, Education Fund, and the Tax Commission Adminstrative Charge Restricted Account. Personnel costs make up 88% of the division's expenditures. 10% of the division's budget is current expenses, the majority of that being postage expenses for sending billing notices and payment agreement documents on delinquent taxpayer accounts. Building rent paid to DFCM and telephone charges are the other larger expense categories.
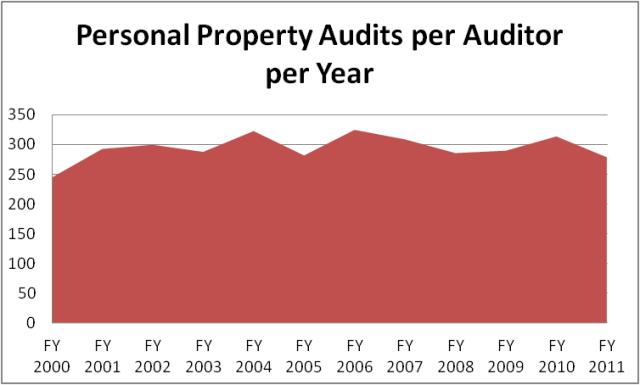
Program: Property Tax Division Function The Property Tax Division appraises and audits complex natural resource extraction and transportation related properties in the state, as well as properties that cross county or state lines. Such properties include those owned by airlines, motor carriers, railroads, and utilities. The Division works with local officials to assure equitable and accurate assessment and taxation under local property tax systems. It also administers the Truth-In-Taxation law. Statutory Authority The Utah Constitution, Article XIII, Section 6, Paragraph 3 provides authority for the State Tax Commission to assess, adjust, and equalize property values and to revise local property tax levies when necessary. The Property Tax Division also draws authority from the Property Tax statute contained in Utah Annotated Code Title 59, Chapter 2. Performance The Property Tax Division considers as indicative of its performance the percentage of centrally assessed companies valued on time. Since FY 2001, this has been consistent at 100%. As indicative of productivity improvement, the Division tracks the number of personal property audits per auditor per year. FY 2011 performance measures:
 Funding Detail 97% of the Property Tax Division's financing comes from the Education Fund. A portion of funding comes from a dedicated credit property assessment fee authorized by UCA 59-2-703 and 59-2-705. Expenditures within the Property Tax Division comprise personnel services (90%), current expenses (7%), and travel (3%). The top three personnel services areas are: Tax Appraisal Specialists and Managers and Personal Property Appraisers and Managers, Research Analysts & Consultants, and Executive Management. The largest current expenses are building costs paid to DFCM. The travel budget comprised hotel and motor pool vehicle charges for staff traveling throughout the state in carrying out assessment and oversight responsibilities.
Function The Division of Motor Vehicles (DMV) administers statewide vehicle title, registration, and related functions. It implements motor vehicle policy and procedure and helps maintain the State's motor vehicle computer system. Also, the DMV provides training to all customer service agents, manages a telephone section for statewide assistance, processes impound and revocation information, and manages vehicle-related appeals. Additionally, the DMV administers the International Registration Plan and the International Fuel Tax Administration Plan. Utah Code 59-2-406 authorizes the Tax Commission to contract with county governments, at the counties' option, to provide local customer services for the combined collection of the county's fee-in-lieu and Title 41 Motor Vehicle Fees. Several counties have elected to retain those functions. Fees for the reciprocal services provided between the State and counties are established in statute. Subsection 406 (3) sets the reimbursement fee and instructs that an adjustment be made each year based on the prior year's consumer price index change. The approval of fees is made by the Legislature. Statutory Authority Utah Annotated Code Title 41 covers the State's motor vehicle laws. Title 41, Chapter 1a is the primary section adminstered by the Motor Vehicle Division, which includes registration requirements and motor vehicle fees. The Motor Vehicle Division also draws authority from Title 41, Chapter 22 to administer Off-Highway vehicle registration requirements, and Title 73, Chapter 18 to administer Boat Registration and Fee requirements. Performance In terms of work to be managed, the Motor Vehicle Division deals with:
Although largely dependent upon the demand side, the Division tracks internet renewals and considers the increasing use of internet and on-the-spot transactions as indicative of its effort to improve efficiency. The number of internet renewals has grown from 67,534 in FY 2001 to 600,343 in FY 2011 and the number of on-the-spot transactions has grown from 9,062 in FY 2001 to 474,829 in FY 2011. Funding Detail 52% of the Motor Vehicle Division's funding comes from Dedicated Credits, followed by General Fund at 35%, and the Transportation Fund at 11%. For FY 2011, personnel costs make up 54% of the division's expenditures, and 44% of the division's budget is current expenses. This includes expenses associated with paying counties to perform motor vehicle services for county-run offices, postage costs associated with mailing renewal notices and sending out decals for online transactions, merchant fees for accepting credit cards and online payments, and building lease costs for branch offices.
Program: Motor Vehicle Enforcement Division Function The Motor Vehicle Enforcement Division (MVED) protects Utah citizens from motor vehicle fraud and attempts to foster a healthy motor vehicle sales environment. Officer duties include title, odometer and motor vehicle dealer fraud investigations, regulatory licensing enforcement, VIN inspections, registration enforcement, and investigation of consumer complaints against licensed dealers, commercial auto theft, and salvage vehicle fraud. During FY 2011 the number of motor vehicle dealers and motor vehicle salesmen in the state reached 17,400. Statutory Authority Utah Annotated Code Title 41 covers the State's motor vehicle laws. Title 41, Chapter 3 is the primary section adminstered by the MVED. The Chapter specifies motor vehicle business regulations. Performance The Division tracks the total number of motor vehicle crime investigations each year in order to assess the work load and output of investigative staff. The number of crime investigations in FY 2011 declined to 2,410 from 2,500 in FY 2010. This is below the ten year average of 2,625. Each year, MVED officers recover more stolen vehicles than other law enforcement officers because of an emphasis on vehicle enforcement. The following graph shows the number of stolen vehicles recovered over time. In FY 2011, the number of recovered stolen vehicles was 429, a decrease of 5% when compared to the FY 2010 count of recovered stolen vehicles.  Funding Detail The greatest portion of the Motor Vehicle Enforcement Division's (MVED) funding is in the form of dedicated credits. The temporary permit fee is issued by vehicle dealers upon sale of a vehicle and it generates the greatest amount of revenue for MVED's dedicated credits. Senate Bill 106 of the 2007 General Session removed the temporary permit fee from statute. The Motor Vehicle Enforcement Division is now authorized to request modification of this fee in the budget process to cover division cost increases, as well as compensation package costs. During the 2009 General Session, the Legislature authorized this fee to increase from $8 per transaction to $12. 80% of the division's budget is allocated to personnel services for the enforcement of the state's vehicle registration laws, fraud and theft detection, and the oversight functions assigned to the division related to the motor vehicle industry. Current expenses are 16% of the division's budget, with vehicle and communication costs being the major areas of expense. Other large expense categories are dispatch services and vendor credit card processing costs.
|