Pew Findings - Utah Prison Cost Drivers - Gary R. Syphus Last Updated: June 20, 2014
In February of 2014, state leaders requested that the Pew
Charitable Trusts' Public Safety Performance Project "conduct research and
analysis of Utah's sentencing and corrections system, develop inmate population
impact statements for use in our state's forthcoming decisions regarding the
potential relocation of the Utah State Prison in Draper, and explore policy
options that would hold offenders accountable, improve public safety, and
contain corrections costs."
The Pew Charitable Trusts' responded by sending a team of
people that are analyzing Utah data to help accommodate the request. There is
an ongoing series of presentations of their findings that shed light on Utah's
prison cost drivers, and thus may help provide information to make decisions to
help the state realize the "best bang for your buck" when it comes to
an effective sentencing and corrections' policy, budget, administrative and
other matters.
With the annual cost of a prisoner estimated at about
$28,400 and trending upward, decisions regarding sentence length, proper
allocation of resources, proper community re-entry programs and others become
increasingly important.
In the May meeting of the Commission on Criminal and
Juvenile Justice (CCJJ), the Pew reported on prison cost drivers. Some key
takeaways are:
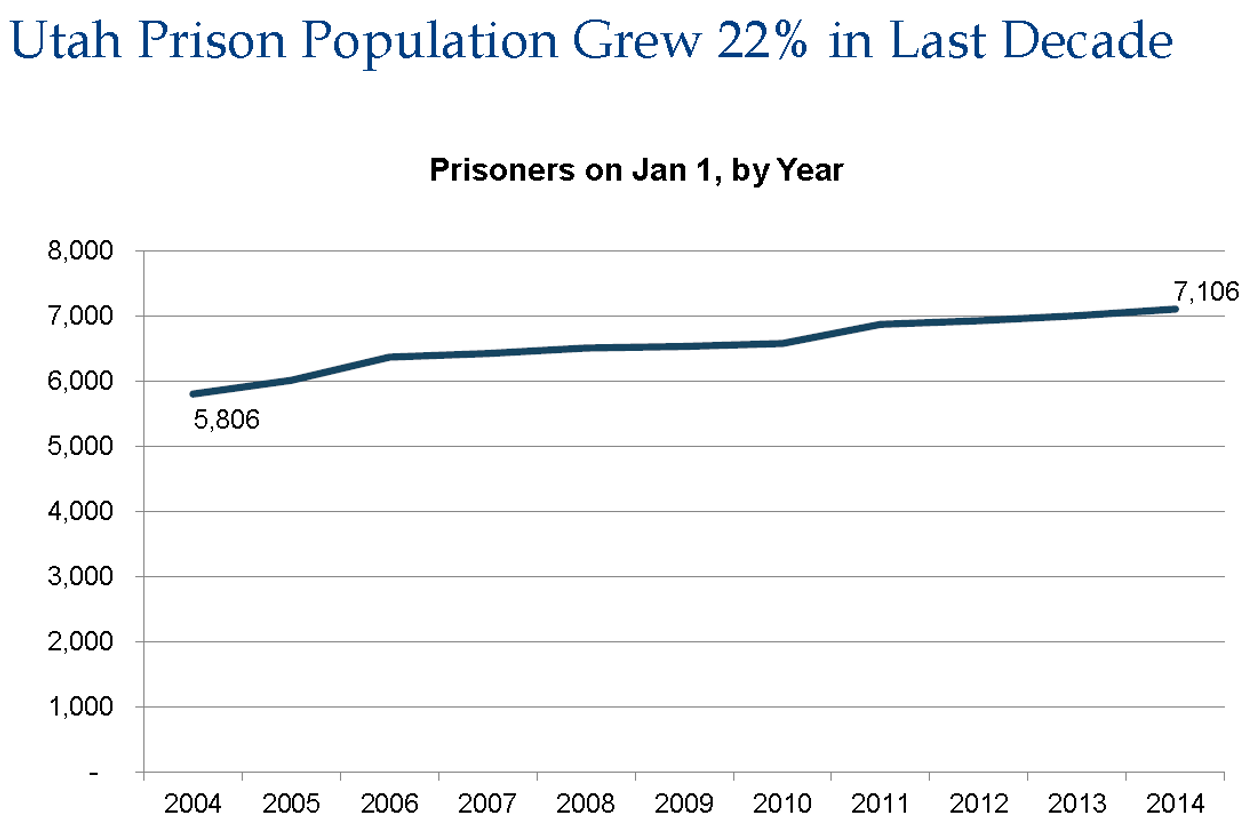
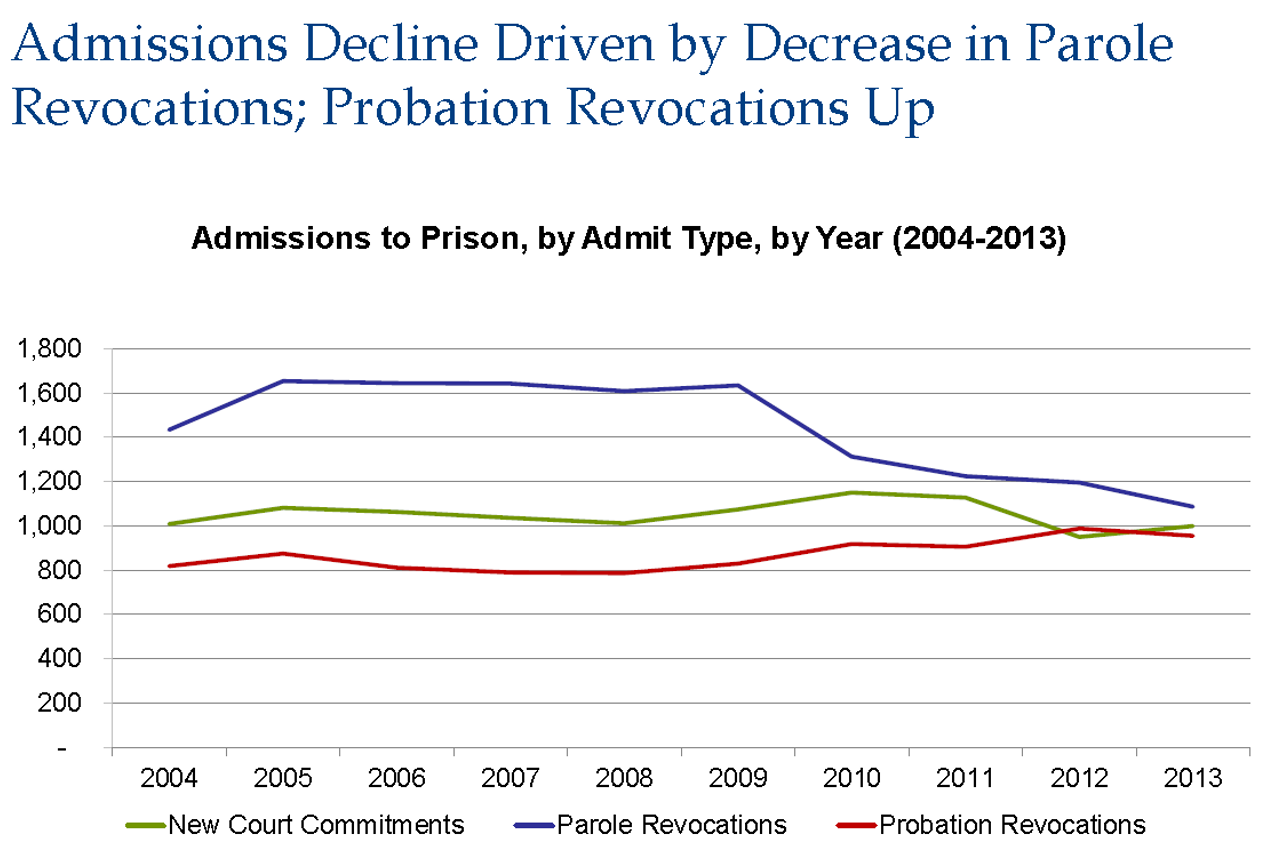
1. Admissions to prison are in decline even though
prison population increased.

2. Prison growth is not driven by state
population growth or crime rates.
a. Almost half (46%) of prison population made up
of offenders revoked from supervision;
b. Probation
technical revocations are taking up 67% more prison bed space over last
decade; and
c. Technical
violations make up a greater share (67% in 2013 versus 56% in 2004) of
Utah's prison admissions.


3. Nonviolent
2nd and 3rd degree offenders have both more admissions and longer time
served, leading to significant growth in prison bed use.
4 The number of sex offenders in prison grew 42%,
likely due to change in time served.
5. Finally, the length of stay for offenders has
increased over time.

As policy, administrative, and budget decisions are made, this information is valuable to determine balance between public safety, rehabilitation, and resources.
In February of 2014, state leaders requested that the Pew Charitable Trusts' Public Safety Performance Project "conduct research and analysis of Utah's sentencing and corrections system, develop inmate population impact statements for use in our state's forthcoming decisions regarding the potential relocation of the Utah State Prison in Draper, and explore policy options that would hold offenders accountable, improve public safety, and contain corrections costs."
The Pew Charitable Trusts' responded by sending a team of people that are analyzing Utah data to help accommodate the request. There is an ongoing series of presentations of their findings that shed light on Utah's prison cost drivers, and thus may help provide information to make decisions to help the state realize the "best bang for your buck" when it comes to an effective sentencing and corrections' policy, budget, administrative and other matters.
With the annual cost of a prisoner estimated at about $28,400 and trending upward, decisions regarding sentence length, proper allocation of resources, proper community re-entry programs and others become increasingly important.
In the May meeting of the Commission on Criminal and Juvenile Justice (CCJJ), the Pew reported on prison cost drivers. Some key takeaways are:
1. Admissions to prison are in decline even though prison population increased.

2. Prison growth is not driven by state population growth or crime rates.
a. Almost half (46%) of prison population made up of offenders revoked from supervision;
b. Probation technical revocations are taking up 67% more prison bed space over last decade; and
c. Technical violations make up a greater share (67% in 2013 versus 56% in 2004) of Utah's prison admissions.


3. Nonviolent 2nd and 3rd degree offenders have both more admissions and longer time served, leading to significant growth in prison bed use.
4 The number of sex offenders in prison grew 42%, likely due to change in time served.
5. Finally, the length of stay for offenders has increased over time.

As policy, administrative, and budget decisions are made, this information is valuable to determine balance between public safety, rehabilitation, and resources.