Compendium of Budget Information for the 2013 General Session
| Executive Offices & Criminal Justice Appropriations Subcommittee | ||||||||||||||||||||||||||||||||||||||||||||||||||||||||||||||||||||||||||||||||||||||||||||||||||||||||||||||||||||||||||||||||||||||||||||||||||||||||||||||||||||||||||||||||||||||||||||||||||||||||||||||||||||||||||||||||||||||||||||||||||||||||||||||||||||||||||||||||||||||||||||||||||||||||||||||||||||||||||||||||||||||||||||||||||||||||||||||||||||||||||||||||||||||||||||||||||||||||||||||||||||||||||||||||||||||||||||||||||||||||||||||||||||||||||||||||||||||||||||||||||||||||||||||||||||||||||||||||||||||||||||||||||||||||||||||||||||||||||||||||||||||||||||||||||||||||||||||||||||||||||||||||||||||||||||||||||||||||||||||||||
| <-Previous Page | Subcommittee Table of Contents | Next Page-> | ||||||||||||||||||||||||||||||||||||||||||||||||||||||||||||||||||||||||||||||||||||||||||||||||||||||||||||||||||||||||||||||||||||||||||||||||||||||||||||||||||||||||||||||||||||||||||||||||||||||||||||||||||||||||||||||||||||||||||||||||||||||||||||||||||||||||||||||||||||||||||||||||||||||||||||||||||||||||||||||||||||||||||||||||||||||||||||||||||||||||||||||||||||||||||||||||||||||||||||||||||||||||||||||||||||||||||||||||||||||||||||||||||||||||||||||||||||||||||||||||||||||||||||||||||||||||||||||||||||||||||||||||||||||||||||||||||||||||||||||||||||||||||||||||||||||||||||||||||||||||||||||||||||||||||||||||||||||||||||||||||
Function The State Treasurer budget consists of only one line item. The line item has four programs: Treasury and Investment, Unclaimed Property, Money Management Council, and Financial Assistance. Intent Language
Funding Detail For more detail about a particular source of finance or organizational unit, click a linked entry in the left column of the table(s) below.
Program: Treasury and Investment Function This program adheres to the Money Management Act and Rules of the Money Management Council, and uses appropriate investment research tools to maximize the safety of state and local government funds invested and to earn competitive yields. The Treasurer also maintains the Public Treasurers' Investment Fund (PTIF) so that other governmental entities can pool their idle money together for professional management, a high degree of liquidity and optimal return on funds. All available funds are invested each day at competitive interest rates. The primary investment instruments used are bank certificates of deposit, commercial paper, short-term corporate notes, and obligations of the U. S. Treasury and government agencies. The Treasurer is a member of the State Bonding Commission and the State Building Ownership Authority, which issues debt for the state. He oversees the team of professionals who work together to issue debt including the financial advisor, bond counsel, disclosure counsel and underwriters. He coordinates all relations with bond rating agencies including formal presentations at least once a year. The Treasurer also manages the investments of the State School and Institutional Trust Funds. The dividend and interest earnings from the State School Fund provide income for the Permanent School Fund, which allocates funding directly to individual schools statewide. Performance The following chart shows historical interest rates earned by the PTIF. Rates have been less than one percent since June of 2009. A review of records back to 1981 shows this is the first time interest rates have fallen below one percent in that time frame. The PTIF invests only in securities authorized by the Money Management Act and while yield is important, the primary objective of the PTIF is safety of principal. Returns are directly correlated to the relative level of short-term interest rates. Considering that State and local government budgets are constrained, interest earned on PTIF investments is of critical importance. In FY 2012 the rate fluctuated between a low of .538 percent (August 2011) and a high of .7841 percent (February 2012). 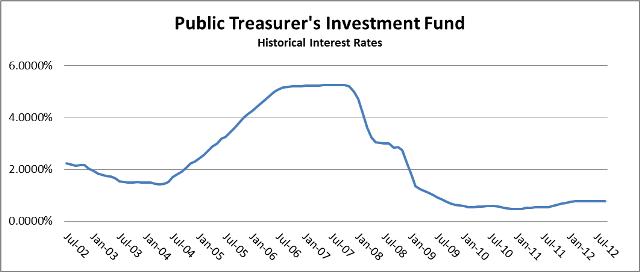 The next measure provides a comparison between PTIF performance and that of a fund with similar characteristics, the Vanguard Prime Money Market Fund. FY 2012 Spread between PTIF interest rate and benchmark interest rate: 0.59% 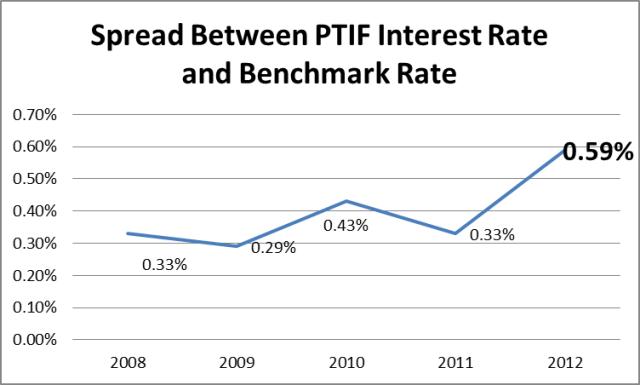 The dividend and interest earnings from the State School Fund provide funding directly to schools statewide. The State School and Institutional Trust Fund portfolios hold a broadly diversified mix of investments, including domestic equities, domestic fixed income, international equities and real estate. Given the substantial breadth of underlying investments held within the portfolio, the factors which impact the investments are numerous, but in simplest terms, the investments are impacted primarily by global economic conditions and the financial performance of the underlying diversified investments (stocks and bonds, primarily) that are maintained within the portfolio. The chart below depicts historical dividend and interest income to the Permanent School Fund by fiscal year and provides a measure of its investment performance over time. 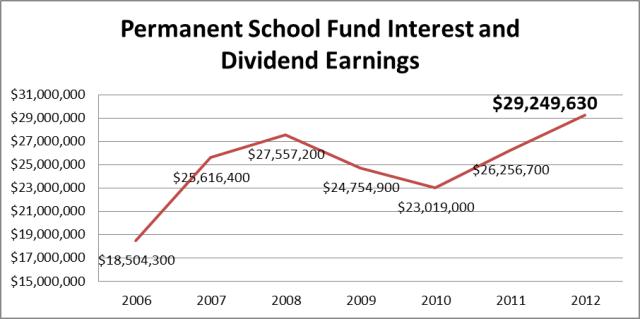 Interest and dividend earnings increased from FY 2011 to FY 2012 for three primary reasons:
Funding Detail
Function The Unclaimed Property Program is responsible for reuniting lost or abandoned property with its rightful owners. Property types include savings accounts, life insurance policies, payroll checks, safe deposit box contents, stocks and mutual funds, and other types of property. Any amount not returned to rightful owners is deposited in the Uniform School Fund. Each year the division is required, under UCA 67-4a-402, to publish notice of property received during the year in a newspaper having general circulation in Utah. Additional outreach programs include billboard ads, radio ads, locating services which enable owners to search for their names in the database, and listing all names and addresses on mine.utah.gov and missingmoney.com. Several employees are actively involved in locating efforts. The Unclaimed Property Division maximizes returns of abandoned property to owners through examining current business processes and implementing improvements where needed. In addition, the division continues to increase productivity through the adoption of new IT enabled processes such as document imaging. Statutory Authority Statutory authority is provided within UCA 67-4a, "Unclaimed Property Act." Performance The top three measures identified for this program include 1) Number of claims paid 2) Amount of unclaimed property claims paid, and 3) Number of claims initiated. The purpose of the Unclaimed Property Division is to reunite rightful owners with their properties, and to safeguard those properties until such disbursements are made. This measure tracks the number of such disbursements and is a primary way to gauge the effectiveness of the division's efforts. 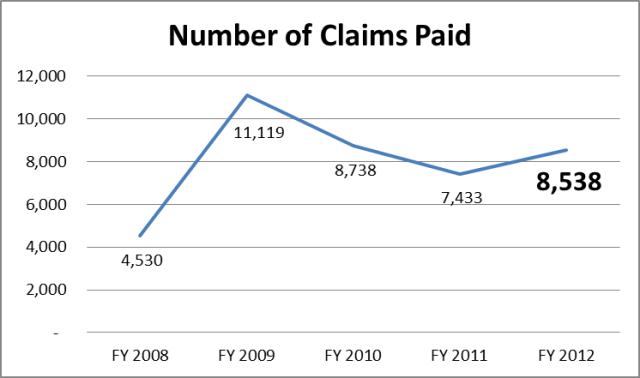 This is the total dollar amount of claims paid to the rightful owners of Unclaimed Property, and is another primary measure of the division's efficacy in its primary mission. 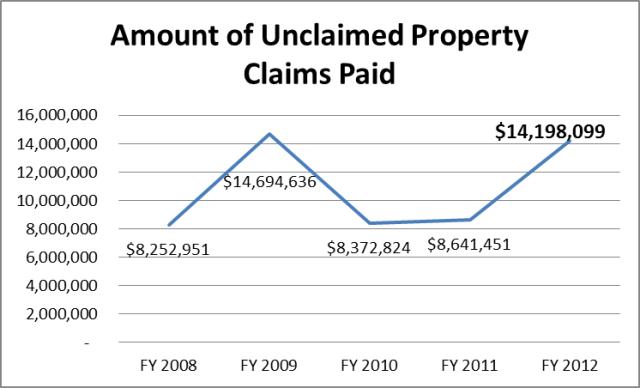 The number of claims initiated is tracked and evaluated in concert with total number of claims paid. It provides an additional measure of the division's efforts to ensure that properties are safeguarded and paid out only to rightful owners. The division must process every claim submitted in such a way as to ensure that properties are only paid to rightful owners. Some initiated claims do not result in disbursements, but require significant processing and due diligence nonetheless. Number of Claims Initiated
Funding Detail The program's administrative costs are paid from the Unclaimed Property Trust Fund as allowed in UCA 67-4a-405. The fund receives proceeds from intangible property escheated to the state, including proceeds from the sale of abandoned property.
Program: Money Management Council Function The Utah Money Management Council is responsible for the oversight of bank deposits and investments maintained by all Utah public treasurers. This involves overseeing and supporting over 500 public treasurers from municipalities of all types; large and small, urban and rural. Additionally, the council must oversee and monitor the degree to which, over 60 financial institutions which hold public funds, comply with the Money Management Act and Rules of the Money Management Council. The State Treasurer's Office provides staff to the council, and the Treasurer serves as the Council's executive secretary without voting rights. The council is comprised of five members appointed by the Governor with the advice and consent of the Senate. At least one member must be from banking, one must be an elected treasurer, one must be an appointed treasurer and one must be experienced in the field of investments. No more than three members of the council may be from the same political party. Statutory Authority Statutory authority for this program is provided within UCA 51 Chapter 7, "Money Management Act." Funding Detail
Function Although this program received an appropriation from dedicated credits for FY 2013, it is not currently in use by the Treasurer. When operational, the program evaluates proposals for water and other infrastructure development submitted to the Community Impact Board, the Board of Water Resources, the Water Pollution Control Committee and the Safe Drinking Water Committee. It prioritizes and makes standardized responses. Any personnel costs are funded by the boards which utilize the service. Funding Detail
| ||||||||||||||||||||||||||||||||||||||||||||||||||||||||||||||||||||||||||||||||||||||||||||||||||||||||||||||||||||||||||||||||||||||||||||||||||||||||||||||||||||||||||||||||||||||||||||||||||||||||||||||||||||||||||||||||||||||||||||||||||||||||||||||||||||||||||||||||||||||||||||||||||||||||||||||||||||||||||||||||||||||||||||||||||||||||||||||||||||||||||||||||||||||||||||||||||||||||||||||||||||||||||||||||||||||||||||||||||||||||||||||||||||||||||||||||||||||||||||||||||||||||||||||||||||||||||||||||||||||||||||||||||||||||||||||||||||||||||||||||||||||||||||||||||||||||||||||||||||||||||||||||||||||||||||||||||||||||||||||||||
| <-Previous Page | Next Page-> |
COBI contains unaudited data as presented to the Legislature by state agencies at the time of publication. For audited financial data see the State of Utah's Comprehensive Annual Financial Reports.