Compendium of Budget Information for the 2013 General Session
| Executive Offices & Criminal Justice Appropriations Subcommittee | ||||||||||||||||||||||||||||||||||||||||||||||||||||||||||||||||||||||||||||||||||||||||||||||||||||||||||||||||||||||||||||||||||||||||||||||||||||||||||||||||||||||||||||||||||||||||||||||||||||||||||||||||||||||||||||||||||||||||||||||||||||||||||||||||||||||||||||||||||||||||||||||||||||||||||||||||||||||||||||||||||||||||||||||||||||||||||||||||||||||||||||||||||||||||||||||||||||||||||||||||||||||||||||||||||||||||||||||||||||||||||||||||||||||||||||||||||||||||||||||||||||||||||||||||||||||||||||||||||||
| <-Previous Page | Subcommittee Table of Contents | Next Page-> | ||||||||||||||||||||||||||||||||||||||||||||||||||||||||||||||||||||||||||||||||||||||||||||||||||||||||||||||||||||||||||||||||||||||||||||||||||||||||||||||||||||||||||||||||||||||||||||||||||||||||||||||||||||||||||||||||||||||||||||||||||||||||||||||||||||||||||||||||||||||||||||||||||||||||||||||||||||||||||||||||||||||||||||||||||||||||||||||||||||||||||||||||||||||||||||||||||||||||||||||||||||||||||||||||||||||||||||||||||||||||||||||||||||||||||||||||||||||||||||||||||||||||||||||||||||||||||||||||||||
Function The State Auditor consists of only one line item. The line item has three programs: Administration, Auditing, and State and Local Government. Intent Language
Funding Detail For more detail about a particular source of finance or organizational unit, click a linked entry in the left column of the table(s) below.
Function The Administration program consists of funding for the personnel services and other costs of the State Auditor, an administrative assistant, and other office administrative staff. Funding Detail
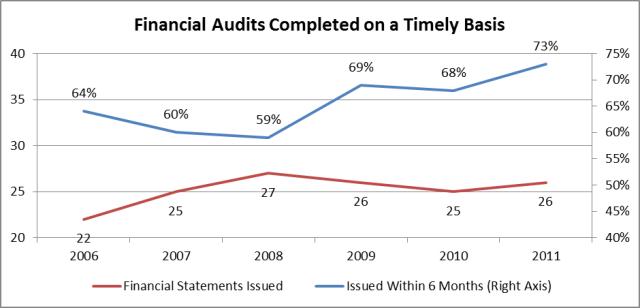
Function The Auditing Program is primarily responsible for performing financial and compliance audits of state agencies, departments, colleges and universities, and quasi-state agencies on a regular basis. The program is responsible for auditing the state's entity-wide Comprehensive Annual Financial Report. This includes financial auditing as well as testing for compliance with material state and other laws and regulations, and reviewing significant internal controls. Colleges and universities and some state agencies also issue separate annual financial statements, which the Auditing Program audits. The Auditing Program also performs the federally mandated "single audit." The single audit is an entity-wide audit of federal funds to determine whether the funds were spent in accordance with federal laws and regulations. The single audit also requires a review of internal controls used in administering federal assistance programs. The program uses a risk and materiality based audit approach to focus audit efforts on essential areas. Contracted CPA firms are also used in the program's audit plan where feasible and necessary. The program uses a risk-based approach to prioritize audits of areas that do not receive direct audit coverage in required audits. The program also investigates issues from Hotline calls and performs other auditing services as requested by the Legislature or State agencies. The required audits are performed in accordance with generally accepted auditing standards, Government Auditing Standards issued by the U.S. Government Accountability Office, and where applicable, the federal Single Audit Act and OMB Circular A-133. Costs of the single audit are charged back to the applicable programs. Costs of certain other audits are charged back to the agencies where allowed by statute or specially requested. Performance As a measure of quality control and adherence to auditing standards, the State Auditor's Office undergoes an external peer review every three years. In the most recent peer review, performed in April 2011 by the National State Auditors Association, the State Auditor's Office received a clean opinion. The State Auditor�s Office has received clean opinions in each peer review for over 30 years. To track efficiency and productivity, the State Auditor records multiple performance measures. Results are included below (Note: Due to the ongoing nature of certain audits at the release of this report, some measures for FY 2012 have not been obtained. As a result, the most up-to-date numbers for the respective measures for which this is the case will be reported, generally FY 2011 results): Timeliness of Financial Statements Audited (FY 2011):
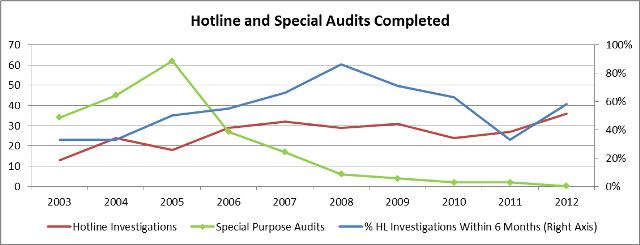
 Hotline and Special Audits Completed:
  Funding Detail
Program: State and Local Government Function The Local Government Program has the responsibility to ensure uniform accounting, budgeting, and financial reporting of the state's local governments. To that end, the program provides consultation, training, budget and financial reporting forms, and uniform accounting services to local governments. The program publishes a Uniform Accounting Manual, which gives guidance to local governments in budgeting, accounting, financial reporting, auditing and complying with state legal requirements. The program prescribes the budget forms used by all units of local governments. The program also publishes the State Legal Compliance Audit Guide which is used by CPA firms for testing compliance with state laws. All local governments as well as certain nonprofit organizations are required by law to file annual financial reports with the State Auditor's Office. The program reviews the reports (over 900) to determine if applicable standards are met. The program has been scanning all budgets and financial reports received from local governments into electronic form. This provides citizens, research groups, and financial advisors greater accessibility to these documents. Funding Detail In order to comply with statutory mandates during lean budget times, the Auditor has discussed the possibility of moving personnel resources from this program to the Auditing program. Although the table below shows FY 2011 appropriated FTE at 1.5 (an estimate made during the 2010 General Session), actual FTE were 3.0.
| ||||||||||||||||||||||||||||||||||||||||||||||||||||||||||||||||||||||||||||||||||||||||||||||||||||||||||||||||||||||||||||||||||||||||||||||||||||||||||||||||||||||||||||||||||||||||||||||||||||||||||||||||||||||||||||||||||||||||||||||||||||||||||||||||||||||||||||||||||||||||||||||||||||||||||||||||||||||||||||||||||||||||||||||||||||||||||||||||||||||||||||||||||||||||||||||||||||||||||||||||||||||||||||||||||||||||||||||||||||||||||||||||||||||||||||||||||||||||||||||||||||||||||||||||||||||||||||||||||||
| <-Previous Page | Next Page-> |
COBI contains unaudited data as presented to the Legislature by state agencies at the time of publication. For audited financial data see the State of Utah's Comprehensive Annual Financial Reports.