Compendium of Budget Information for the 2013 General Session
| Infrastructure & General Government Appropriations Subcommittee | ||||||||||||||||||||||||||||||||||||||||||||||||||||||||||||||||||||||||||||||||||||||||||||||||||||||||||||||||||||||||||||||||||||||||||||||||||||||||||||||||||||||||||||||||||||||||||||||||||||||||||||||||||||||||||||||||||||||||||||||||||||||||||||||||||||||||||||||||||||||||||||||||||||||||||||||||||||||||||||||||||||||||||||||||||||||||||||||||||||||||||||||||||||||||||||||||||||||||||||||||||||||||||||||||||||||||||||||||
| <-Previous Page | Subcommittee Table of Contents | Next Page-> | ||||||||||||||||||||||||||||||||||||||||||||||||||||||||||||||||||||||||||||||||||||||||||||||||||||||||||||||||||||||||||||||||||||||||||||||||||||||||||||||||||||||||||||||||||||||||||||||||||||||||||||||||||||||||||||||||||||||||||||||||||||||||||||||||||||||||||||||||||||||||||||||||||||||||||||||||||||||||||||||||||||||||||||||||||||||||||||||||||||||||||||||||||||||||||||||||||||||||||||||||||||||||||||||||||||||||||||||||
Agency: ISF - Technology Services Line Item: ISF - DTS Operations Function The DTS Internal Service Fund contains two programs: Agency Services and Enterprise Technology. Agency Services operates as the IT products and services Pass Thru fund for state agencies. A state agency works with its assigned IT director from DTS to determine needed IT purchases. Enterprise Technology is the central operating unit of the ISF. (It handles most of the workload and has most of the FTEs assigned in the ISF operation.) Funding Detail
Program: ISF - Agency Services Division Function The Agency Services program operates as the IT products and services Pass Thru fund for state agencies. A state agency works with its assigned IT director from DTS to determine needed IT purchases. Statutory Authority The duties of Agency Services are enumerated in UCA 63F-1-604. These duties include providing IT products purchasing support for information technology projects, programs, or functions that are unique to a given executive branch agency. Funding Detail Prior to FY 2007, employees and budgets reflected here were disbursed throughout state government. In FY 2009, most personnel were transferred into the Enterprise Technology program. In FY 2010, the remainder of the personnel were transferred into Enterprise Technology and the Agency Services program changed to include only those costs associated with unique agency IT products purchases. IT products purchasing requirements by agencies are accounted for in their individual budget appropriations. Beginning FY 2012, to avoid double counting by DTS Agency Services, the amounts are no longer reflected as a separate appropriation to DTS.
Program: ISF - Enterprise Technology Division Function The Division of Enterprise Technology (DET) provides other agencies of state government statewide IT services including: network, desktop, telecommunications, hosting, database, mainframe computing, applications, wireless, microwave, print, and other miscellaneous technology services. DET sets rates based on the cost of services it provides. In so doing, the division attempts to leverage economies of scale while minimizing cost to customer agencies. Each year a rate committee, composed of customer agencies, reviews and approves these rates. Statutory Authority UCA 63F-1-404 directs Enterprise Technology to develop and implement an effective enterprise architecture governance model for the executive branch. Enterprise Technology is also charged to provide oversight of information technology projects that impact statewide information technology services, assets, or functions of state government to:
Performance UCA 63F-1-404 also charges Enterprise Technology beginning September 1, 2006, and each September 1 thereafter, to provide the Public Utilities and Technology Interim Committee with performance measures used by the division to measure the quality of service delivered by the division and the results of the performance measures. To meet this responsibility, DET has developed several measures. Certain measures are included here. Following are charts depicting recent division performance. DTS contracts with Science Applications International Corporation (SAIC) annually to conduct an independent comparison of the rates its charges agencies to determine if they are market competitive. SAIC has determined that the rates DTS charges were found to improve to 100 percent Reasonable Value or Better in FY 2012. The following chart depicts the findings of the studies from FY 2007 through FY 2012. 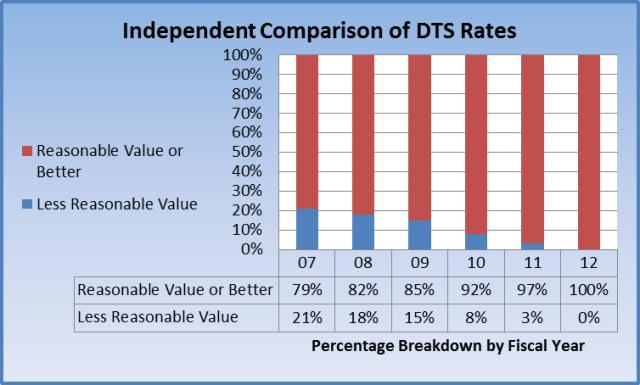 The Customer Satisfaction Survey enables DTS to monitor, measure, and trend the customer agency's experience by measuring satisfaction levels. A survey is automatically sent to the customer agency via email after each service ticket has been resolved. 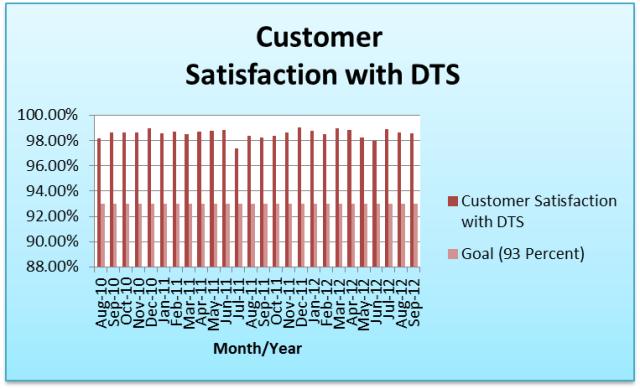 The Time to Initial Response identifies DTS' ability to respond to customer incidents based upon enterprise response standards. It is reported through service tickets and identifies the average time to respond to a customer's need. 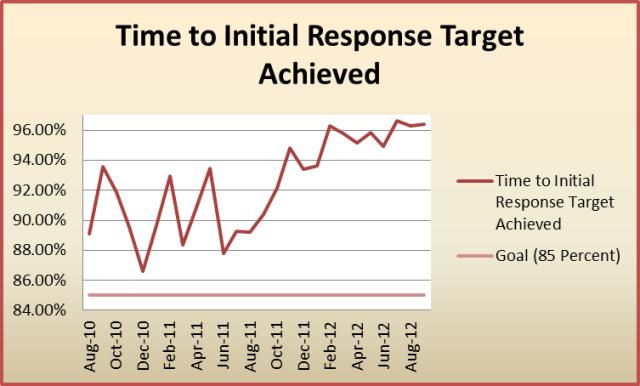 The Total Time to Resolution identifies DTS' ability to resolve customer incidents based upon enterprise resolution standards. It is reported through service tickets and identifies the average time to resolve a customer's issue. 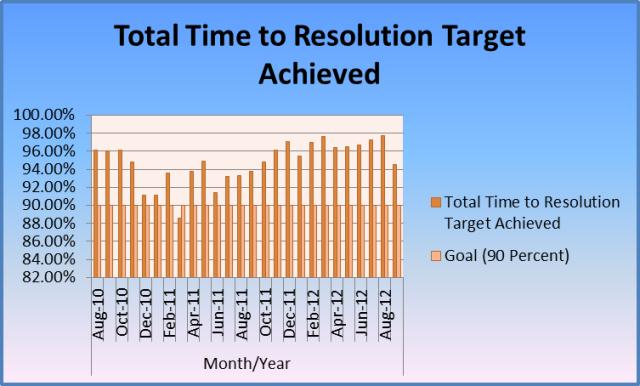 Application Availability monitors, measures, and trends DTS performance of key agency business applications/systems identified in the Service Level Agreements with agencies. 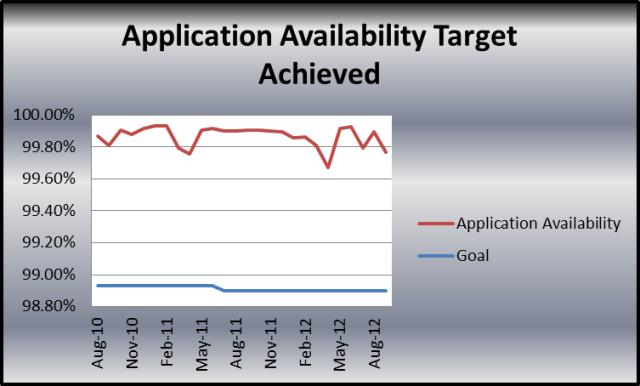 Online services are those services which can be accessed and executed via the internet, as opposed to visiting state agencies to transact business. In FY 2011, the state executed over 25 million transactions online. In September 2012, the number of online services applications available to the public had increased to 1040. 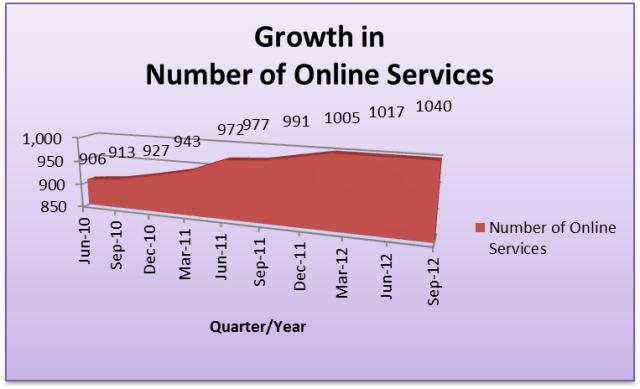 Funding Detail
| ||||||||||||||||||||||||||||||||||||||||||||||||||||||||||||||||||||||||||||||||||||||||||||||||||||||||||||||||||||||||||||||||||||||||||||||||||||||||||||||||||||||||||||||||||||||||||||||||||||||||||||||||||||||||||||||||||||||||||||||||||||||||||||||||||||||||||||||||||||||||||||||||||||||||||||||||||||||||||||||||||||||||||||||||||||||||||||||||||||||||||||||||||||||||||||||||||||||||||||||||||||||||||||||||||||||||||||||||
| <-Previous Page | Next Page-> |
COBI contains unaudited data as presented to the Legislature by state agencies at the time of publication. For audited financial data see the State of Utah's Comprehensive Annual Financial Reports.