Compendium of Budget Information for the 2013 General Session
| Natural Resources, Agriculture, & Environmental Quality Appropriations Subcommittee | ||||||||||||||||||||||||||||||||||||||||||||||||||||||||||||||||||||||||||||||||||||||||||||||||||||||||||||||||||||||||||||||||||||||||||||||||||||||||||||||||||||||||||||||||||||
| <-Previous Page | Subcommittee Table of Contents | Next Page-> | ||||||||||||||||||||||||||||||||||||||||||||||||||||||||||||||||||||||||||||||||||||||||||||||||||||||||||||||||||||||||||||||||||||||||||||||||||||||||||||||||||||||||||||||||||||
Function The mission of the Division of Drinking Water is to cooperatively work with drinking water professionals and the public to ensure a safe and reliable supply of drinking water. Its major functions include the following:
There are five sections within this division, each of which is described below: Administrative Services Section This section provides support services to the division in the areas of budgeting, purchasing, contracting, grants management and personnel. The section also administers the Drinking Water Source Protection Program. Engineering Section This section performs plan reviews for construction of water facilities throughout Utah and issues operating permits for those projects. It also performs grout witness services on new wells as well as construction inspections. Field Services Section This section administers the Operator Certification program and the Backflow Technician program. Field Services takes the lead in emergency response and directs the performance of on-site inspections of existing facilities. Rules Section This section deals with the ongoing operations of drinking water systems by providing technical assistance and implementing the federal rules. This section oversees the operation of 466 community water systems, 68 non-transient non-community water systems, and 481 non-community water systems. Construction Assistance Section The section administers the state and federal loan programs. For those projects that receive financial assistance, this section also reviews plans and performs construction inspections.
Performance Approved public water systems are those that are in substantial compliance with all the division's rules. This measure indicates the percentage of the population that is provided a safe and reliable supply of drinking water. The numbers vary slightly from year to year. If large or very large water systems had non-compliance problems, the numbers would differ significantly. 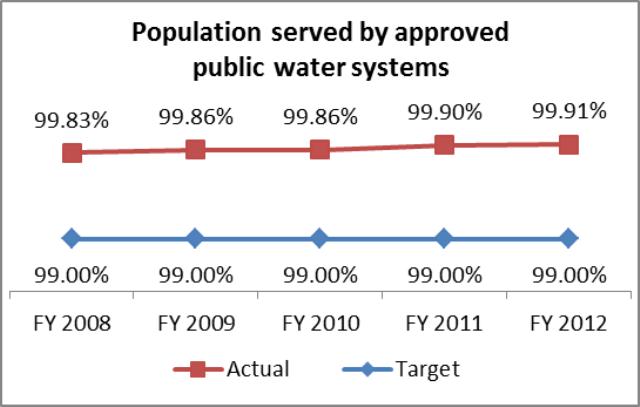 This measure indicates the percentage of public drinking water systems with an approved rating. This measure tracks the changes amongst small and very small systems; these systems make up over 75% of the public water systems in the state. 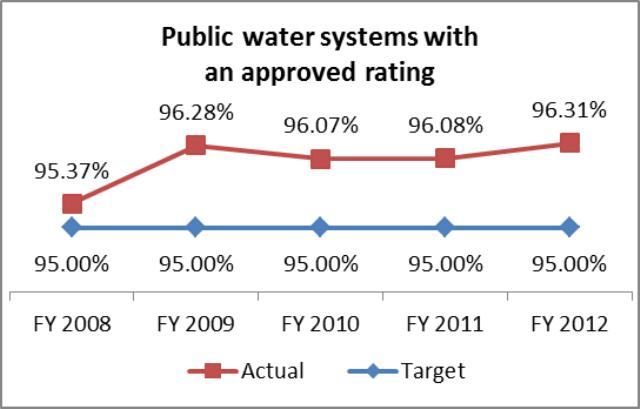 This measure is a count of all water-borne disease outbreaks in the state. The 2008 outbreak was at the Maple Dell Boy Scout Camp; and the most recent outbreak was at Cedar Hills. 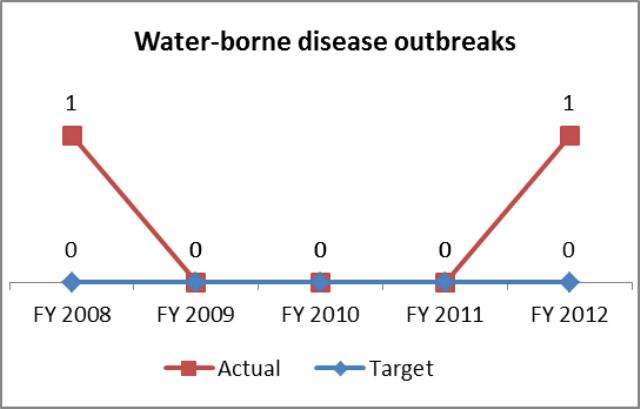 In addition to the key performance measures listed above, the division reported the following performances measures for FY 2012:
Funding Detail For more detail about a particular source of finance or organizational unit, click a linked entry in the left column of the table(s) below.
| ||||||||||||||||||||||||||||||||||||||||||||||||||||||||||||||||||||||||||||||||||||||||||||||||||||||||||||||||||||||||||||||||||||||||||||||||||||||||||||||||||||||||||||||||||||
| <-Previous Page | Next Page-> |
COBI contains unaudited data as presented to the Legislature by state agencies at the time of publication. For audited financial data see the State of Utah's Comprehensive Annual Financial Reports.