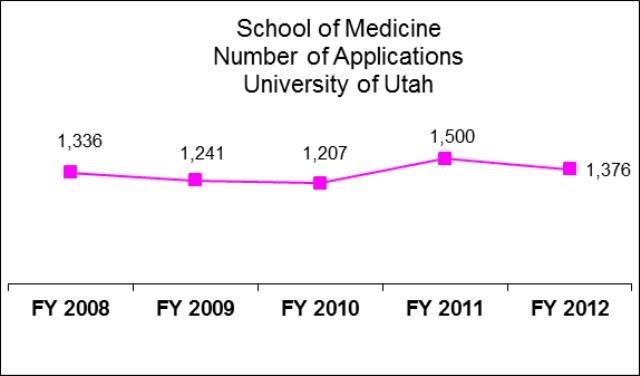
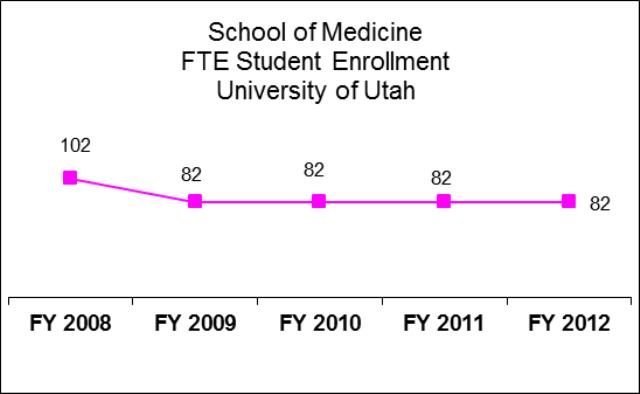
Agency: University of Utah Line Item: School of Medicine Function The School of Medicine (SOM) has three interrelated missions: education, research, and clinical services. The SOM is responsible for the education of physicians and other medical practitioners. In addition, the SOM promotes nationally recognized research. Finally, the SOM is committed to providing advanced and innovative medical procedures to the patients it serves in conjunction with the training of health care professionals.
Statutory Authority The following laws govern the operations of the School of Medicine in addition to the laws previously mentioned: - UCA 53B-4 Utah Interstate Commission for Cooperation in Higher Education (WICHE) outlines cooperative agreement for graduate and professional training in the Western states.
- UCA 53B-17-301 outlines the use of dead bodies for medical purposes.
Performance Each year, the School of Medicine receives a significant number of applications for the available slots.

 Funding Detail For more detail about a particular source of finance or organizational unit, click a linked entry in the left column of the table(s) below. Sources of Finance
(click linked fund name for more info) | 2009
Actual | 2010
Actual | 2011
Actual | 2012
Actual | 2013
Approp | | General Fund | $1,091,000 | $141,100 | $141,100 | $955,900 | $906,100 | | General Fund, One-time | $0 | $1,877,200 | $0 | $0 | $0 | | Education Fund | $22,657,000 | $19,588,000 | $19,588,000 | $19,520,300 | $19,712,500 | | Dedicated Credits Revenue | $12,578,200 | $13,937,600 | $17,077,600 | $19,043,200 | $14,964,100 | | Beginning Nonlapsing | $4,591,500 | $171,000 | $2,085,500 | $1,122,800 | $1,122,800 | | Closing Nonlapsing | ($171,000) | ($2,085,500) | ($1,122,800) | ($1,897,700) | ($1,122,800) | | Total | $40,746,700 | $33,629,400 | $37,769,400 | $38,744,500 | $35,582,700 |
|---|
| | | | | | Programs:
(click linked program name to drill-down) | 2009
Actual | 2010
Actual | 2011
Actual | 2012
Actual | 2013
Approp |
|---|
| School of Medicine | $40,746,700 | $33,629,400 | $37,769,400 | $38,744,500 | $35,582,700 | | Total | $40,746,700 | $33,629,400 | $37,769,400 | $38,744,500 | $35,582,700 |
|---|
| | | | | | Categories of Expenditure
(mouse-over category name for definition) | 2009
Actual | 2010
Actual | 2011
Actual | 2012
Actual | 2013
Approp |
|---|
| Personnel Services | $30,212,500 | $25,931,500 | $27,248,300 | $29,369,600 | $28,022,600 | | In-state Travel | $141,700 | $187,900 | $187,000 | $168,200 | $154,500 | | Current Expense | $8,566,400 | $7,475,200 | $10,296,900 | $9,109,100 | $7,364,400 | | Capital Outlay | $49,800 | $34,800 | $37,200 | $97,600 | $41,200 | | Other Charges/Pass Thru | $1,776,300 | $0 | $0 | $0 | $0 | | Total | $40,746,700 | $33,629,400 | $37,769,400 | $38,744,500 | $35,582,700 |
|---|
| | | | | | | Other Indicators | 2009
Actual | 2010
Actual | 2011
Actual | 2012
Actual | 2013
Approp |
|---|
| Budgeted FTE | 349.5 | 341.8 | 340.8 | 309.8 | 309.8 | | Actual FTE | 342.0 | 311.8 | 328.2 | 335.5 | 0.0 |
|
|
|
|
|
|
|---|
Subcommittee Table of Contents |

