Agency: Natural Resources Line Item: Wildlife Resources Function The mission of the Division of Wildlife Resources (DWR) is: "Serve the people of Utah as trustee and guardian of the State's wildlife."
In UCA 23-13-3 the Legislature declared that all wildlife within the state, not held by private ownership, is managed by the State (click on the link http://naturalresources.utah.gov/divisions/wildlife.html to go to the website). DWR is the wildlife authority for the state under the broad policymaking authority of the Wildlife Board. There are five Regional Advisory Councils (RACs) that gather information and give input to the Board. The division manages all fish and wildlife species, regulates hunting, fishing and trapping, and conducts non-consumptive activities. The Division employs staff in five regional offices in Ogden, Springville, Vernal, Price, Cedar City, and Salt Lake City. Some of DWR's goals and objectives are: - Improve the overall efficiency of the Utah Division of Wildlife Resources.
- Expand wildlife populations and conserve sensitive species by protecting and improving wildlife habitat.
- Achieve broad-based support for division programs and budgets by demonstrating the value of wildlife to all citizens of Utah.
Statutory Authority The following laws govern operation of the division: - UCA 23-13-3 states that all wildlife not privately owned and legally acquired is legally considered property of the state.
- UCA 23-14-1 creates the Division of Wildlife Resources under the Department of Natural Resources. The Division is the wildlife authority of the state. Subject to the Wildlife Board, the division shall protect, propagate, manage, conserve, and distribute protected wildlife. DWR may initiate civil and criminal proceedings.
Intent Language Under the terms of 63J-1-603 of the Utah Code, the Legislature intends that appropriations provided for the Wildlife Resources Operations line item in Item 7, Chapter 9, Laws of Utah 2011, shall not lapse at the close of FY 2012. Expenditures of these funds are limited to landowner payments $100,000.The Legislature intends that up to $140,000 be spent on livestock damage. $90,000 will be from the General Fund and up to $50,000 will be from the General Fund Restricted - Wildlife Resources account. The Legislature intends that up to $700,000 of Wildlife Resources budget may be used for big game depredation expenses. The Legislature also intends that half of these funds be from the General Fund Restricted - Wildlife Resources account and half from the General Fund. The Legislature further intends that this appropriation shall not lapse at the close of FY 2013. Performance The following are the top measures chosen by the division management to gauge the success of its programs. Licenses Sold: This measure reports the sales trends for fishing (blue line) and hunting (red line) licenses, since these are the main revenue sources for the division. Both trends are on the decline. 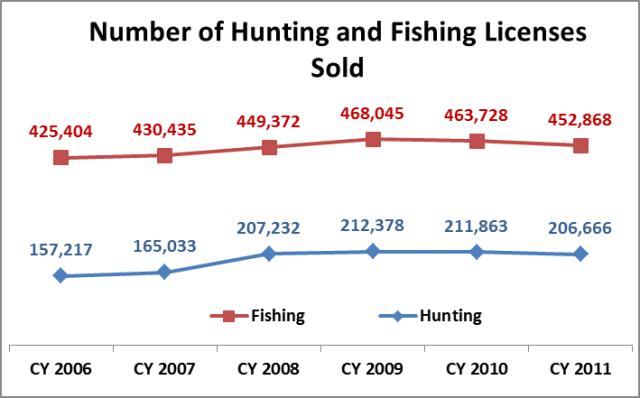 Depredation Payments: The second performance measure tracks the amount of claims and the amount of payments for depredation or crop loss over time. In three of the last five years, the total amount of claims (red line) exceeded the appropriated amounts (blue line). In order to avoid prorating the payment for the claims, the division used existing funding from other programs. 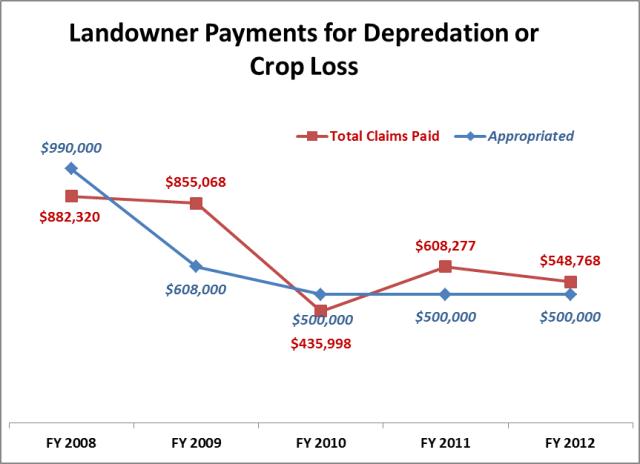 Cougar/Bear Claims: The next performance measure tracks the claims for cougar and bear livestock damage over time. The figure below presents the total claims, the amount appropriated, and the actual amount paid. In FY 2008 and FY 2009 the appropriated amount (red line) was more than the claims received (green line) and division paid (blue line) for all the requested damages. In the last three years, however, the appropriated amount of $140,000 was not sufficient to cover the total claims submitted. In these cases, DWR had to prorate the claim payments to 84% in FY 2010, 74% in FY 2011, and 66% in FY 2012. 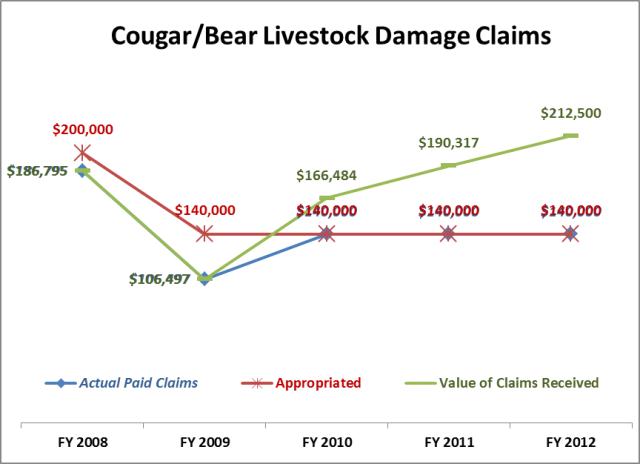 Average Costs for Cougar/Bear Claims: There is an increase in both the number of claims per year as well as the average amount of the claims for cougar/bear damages in the last four years. 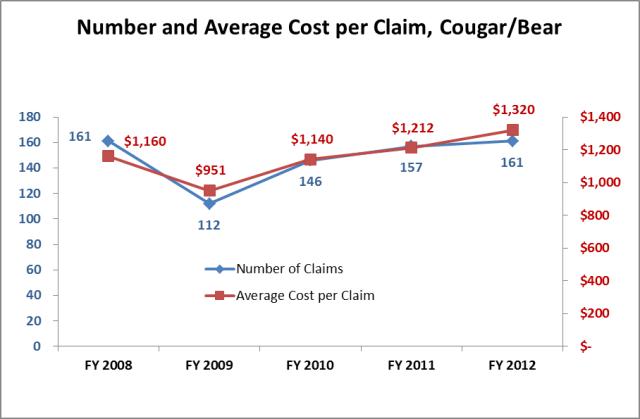 Funding Detail License revenue is deposited into the Wildlife Restricted account. Federal funds primarily come from excise taxes on sporting goods. Sources of Finance
(click linked fund name for more info) | 2009
Actual | 2010
Actual | 2011
Actual | 2012
Actual | 2013
Approp | | General Fund | $6,903,900 | $5,956,100 | $5,697,800 | $5,542,200 | $5,759,900 | | General Fund, One-time | $153,000 | ($87,900) | $100,000 | $100,000 | $300,000 | | Federal Funds | $12,319,100 | $10,971,800 | $14,487,800 | $11,480,900 | $16,144,900 | | Dedicated Credits Revenue | $222,300 | $114,200 | $166,500 | $188,700 | $87,100 | | GFR - Wildlife Habitat | $2,758,900 | $2,700,000 | $2,900,000 | $2,900,000 | $2,900,000 | | GFR - Wildlife Resources | $26,925,700 | $28,290,100 | $29,538,900 | $30,186,800 | $30,752,200 | | GFR - Mule Deer Protection Account | $0 | $0 | $0 | $0 | $500,000 | | GFR - Predator Control | $0 | $0 | $0 | $0 | $600,000 | | Transfers | $167,400 | $175,000 | $115,300 | $131,400 | $167,200 | | Beginning Nonlapsing | $811,900 | $300,000 | $0 | $0 | $0 | | Closing Nonlapsing | ($300,000) | $0 | $0 | $0 | $0 | | Lapsing Balance | ($2,058,100) | ($2,804,100) | ($2,760,300) | ($3,207,300) | $0 | | Total | $47,904,100 | $45,615,200 | $50,246,000 | $47,322,700 | $57,211,300 |
|---|
| | | | | | Programs:
(click linked program name to drill-down) | 2009
Actual | 2010
Actual | 2011
Actual | 2012
Actual | 2013
Approp |
|---|
| Director's Office | $1,609,700 | $1,775,200 | $2,468,300 | $3,146,500 | $3,286,800 | | Administrative Services | $6,122,900 | $6,973,800 | $7,092,400 | $7,040,300 | $7,668,100 | | Conservation Outreach | $2,401,900 | $2,332,800 | $2,396,700 | $2,216,400 | $2,347,200 | | Law Enforcement | $8,038,500 | $8,574,900 | $8,902,000 | $9,030,800 | $8,842,000 | | Habitat Council | $3,308,500 | $2,487,600 | $2,602,200 | $2,600,000 | $3,021,700 | | Habitat Section | $5,291,800 | $3,681,400 | $6,109,800 | $4,563,300 | $4,271,300 | | Wildlife Section | $7,955,200 | $7,609,200 | $8,076,400 | $7,263,000 | $12,174,000 | | Aquatic Section | $13,175,600 | $12,180,300 | $12,598,200 | $11,462,400 | $15,600,200 | | Total | $47,904,100 | $45,615,200 | $50,246,000 | $47,322,700 | $57,211,300 |
|---|
| | | | | | Categories of Expenditure
(mouse-over category name for definition) | 2009
Actual | 2010
Actual | 2011
Actual | 2012
Actual | 2013
Approp |
|---|
| Personnel Services | $28,932,800 | $28,314,100 | $29,272,100 | $28,070,900 | $29,646,400 | | In-state Travel | $226,500 | $255,700 | $220,300 | $231,700 | $222,200 | | Out-of-state Travel | $100,800 | $61,200 | $96,200 | $75,800 | $96,600 | | Current Expense | $14,500,800 | $11,824,900 | $14,182,500 | $13,930,200 | $15,623,600 | | DP Current Expense | $1,258,900 | $1,283,900 | $1,309,200 | $1,191,000 | $1,319,600 | | DP Capital Outlay | ($205,700) | ($3,000) | $0 | $0 | $6,200 | | Capital Outlay | $2,024,600 | $1,949,800 | $258,700 | $556,700 | $252,500 | | Other Charges/Pass Thru | $1,067,300 | $1,925,900 | $4,907,000 | $3,266,400 | $10,044,200 | | Cost Accounts | ($1,900) | $2,700 | $0 | $0 | $0 | | Total | $47,904,100 | $45,615,200 | $50,246,000 | $47,322,700 | $57,211,300 |
|---|
| | | | | | | Other Indicators | 2009
Actual | 2010
Actual | 2011
Actual | 2012
Actual | 2013
Approp |
|---|
| Budgeted FTE | 443.2 | 429.0 | 442.2 | 464.0 | 451.2 | | Actual FTE | 498.8 | 520.0 | 519.5 | 488.7 | 0.0 | | Vehicles | 0 | 421 | 409 | 394 | 408 |
|
|
|
|
|
|
|---|
Subcommittee Table of ContentsProgram: Director's Office Function The Director's Office provides DWR with strategic programmatic and operational direction, organizational structure, budgets, personnel support, and rules. It is also responsible for interaction with the Legislature, Department of Natural Resources, Wildlife Board, Regional Advisory Councils, the media, constituency groups, other government agencies, private institutions and governing bodies. Funding Detail Sources of Finance
(click linked fund name for more info) | 2009
Actual | 2010
Actual | 2011
Actual | 2012
Actual | 2013
Approp | | General Fund | $1,125,000 | $1,006,700 | $1,035,200 | $876,300 | $1,015,900 | | General Fund, One-time | $0 | $0 | $0 | $100,000 | $300,000 | | Federal Funds | $110,100 | $53,000 | $127,300 | $33,400 | $53,900 | | Dedicated Credits Revenue | $133,600 | $30,000 | $91,900 | $129,300 | $20,000 | | GFR - Wildlife Resources | $1,855,200 | $2,680,500 | $3,243,600 | $4,700,900 | $1,729,800 | | Transfers | $167,400 | $175,000 | $150,000 | $131,400 | $167,200 | | Lapsing Balance | ($1,781,600) | ($2,170,000) | ($2,179,700) | ($2,824,800) | $0 | | Total | $1,609,700 | $1,775,200 | $2,468,300 | $3,146,500 | $3,286,800 |
|---|
| | | | | | Categories of Expenditure
(mouse-over category name for definition) | 2009
Actual | 2010
Actual | 2011
Actual | 2012
Actual | 2013
Approp |
|---|
| Personnel Services | $1,786,200 | $1,355,400 | $1,478,200 | $1,500,000 | $1,496,700 | | In-state Travel | $46,100 | $50,500 | $41,900 | $36,900 | $41,900 | | Out-of-state Travel | $19,300 | $17,900 | $24,000 | $10,000 | $24,000 | | Current Expense | $1,057,600 | $226,800 | $751,600 | $1,313,700 | $1,241,600 | | DP Current Expense | $34,400 | $28,600 | $33,600 | $41,700 | $33,600 | | Other Charges/Pass Thru | ($1,333,900) | $96,200 | $139,000 | $244,200 | $449,000 | | Cost Accounts | $0 | ($200) | $0 | $0 | $0 | | Total | $1,609,700 | $1,775,200 | $2,468,300 | $3,146,500 | $3,286,800 |
|---|
| | | | | | | Other Indicators | 2009
Actual | 2010
Actual | 2011
Actual | 2012
Actual | 2013
Approp |
|---|
| Budgeted FTE | 15.1 | 16.0 | 15.2 | 14.0 | 13.7 | | Actual FTE | 15.1 | 14.0 | 13.4 | 12.7 | 0.0 | | Vehicles | 0 | 7 | 7 | 7 | 7 |
|
|
|
|
|
|
|---|
Subcommittee Table of ContentsProgram: Administrative Services Function The Administrative Services program provides support services for the division. All financial activities are managed through the Fiscal Management program. This includes federal aid programs, revenue collection and budgeting, as well as contracts and agreements. The Licensing Program issues and reconciles all hunting and fishing licenses with the regions and retail outlets. This program also is responsible for aeronautic services, facilities management, and computer services through DTS. Funding Detail Sources of Finance
(click linked fund name for more info) | 2009
Actual | 2010
Actual | 2011
Actual | 2012
Actual | 2013
Approp | | General Fund | $529,700 | $772,100 | $584,200 | $285,100 | $669,100 | | General Fund, One-time | $153,000 | ($87,900) | $100,000 | $0 | $0 | | Federal Funds | $86,800 | $104,400 | $128,300 | $196,000 | $105,700 | | GFR - Wildlife Resources | $5,353,400 | $6,185,200 | $6,314,600 | $6,559,200 | $6,893,300 | | Transfers | $0 | $0 | ($34,700) | $0 | $0 | | Total | $6,122,900 | $6,973,800 | $7,092,400 | $7,040,300 | $7,668,100 |
|---|
| | | | | | Categories of Expenditure
(mouse-over category name for definition) | 2009
Actual | 2010
Actual | 2011
Actual | 2012
Actual | 2013
Approp |
|---|
| Personnel Services | $2,892,300 | $2,922,800 | $2,936,700 | $3,020,900 | $3,120,600 | | In-state Travel | $11,600 | $11,500 | $15,700 | $9,400 | $17,600 | | Out-of-state Travel | $3,200 | $1,100 | $4,000 | $3,400 | $4,400 | | Current Expense | $2,591,100 | $3,230,400 | $3,546,600 | $3,364,300 | $3,922,100 | | DP Current Expense | $609,200 | $603,600 | $584,800 | $540,100 | $599,200 | | Capital Outlay | $5,500 | $80,300 | $0 | $17,000 | $0 | | Other Charges/Pass Thru | $10,000 | $124,100 | $4,600 | $85,200 | $4,200 | | Total | $6,122,900 | $6,973,800 | $7,092,400 | $7,040,300 | $7,668,100 |
|---|
| | | | | | | Other Indicators | 2009
Actual | 2010
Actual | 2011
Actual | 2012
Actual | 2013
Approp |
|---|
| Budgeted FTE | 52.0 | 48.0 | 52.0 | 49.0 | 48.0 | | Actual FTE | 47.7 | 49.0 | 48.9 | 48.8 | 0.0 | | Vehicles | 0 | 0 | 1 | 0 | 0 |
|
|
|
|
|
|
|---|
Subcommittee Table of ContentsProgram: Conservation Outreach Function The Conservation Outreach Section handles communications, media relations, publications, website administration, the Great Salt Lake Nature Center at Farmington Bay, Hardware Ranch, human dimensions (customer feedback), the Dedicated Hunter program, volunteer services, and watchable wildlife. Funding Detail Sources of Finance
(click linked fund name for more info) | 2009
Actual | 2010
Actual | 2011
Actual | 2012
Actual | 2013
Approp | | General Fund | $541,700 | $412,100 | $313,200 | $276,900 | $408,400 | | Federal Funds | $2,300 | $800 | $600 | $1,300 | $700 | | Dedicated Credits Revenue | $88,700 | $84,200 | $74,600 | $59,400 | $67,100 | | GFR - Wildlife Resources | $1,769,200 | $1,835,700 | $2,008,300 | $1,878,800 | $1,871,000 | | Total | $2,401,900 | $2,332,800 | $2,396,700 | $2,216,400 | $2,347,200 |
|---|
| | | | | | Categories of Expenditure
(mouse-over category name for definition) | 2009
Actual | 2010
Actual | 2011
Actual | 2012
Actual | 2013
Approp |
|---|
| Personnel Services | $1,707,700 | $1,825,400 | $1,900,000 | $1,736,100 | $1,752,400 | | In-state Travel | $9,000 | $11,500 | $10,800 | $6,700 | $10,800 | | Out-of-state Travel | $5,400 | $2,400 | $5,900 | $1,600 | $5,900 | | Current Expense | $621,000 | $429,300 | $413,400 | $415,700 | $511,600 | | DP Current Expense | $58,800 | $57,600 | $60,400 | $56,300 | $60,300 | | DP Capital Outlay | $0 | $0 | $0 | $0 | $6,200 | | Capital Outlay | $0 | $6,600 | $6,200 | $0 | $0 | | Total | $2,401,900 | $2,332,800 | $2,396,700 | $2,216,400 | $2,347,200 |
|---|
| | | | | | | Other Indicators | 2009
Actual | 2010
Actual | 2011
Actual | 2012
Actual | 2013
Approp |
|---|
| Budgeted FTE | 29.0 | 27.0 | 29.0 | 25.0 | 23.4 | | Actual FTE | 25.0 | 28.0 | 27.1 | 24.5 | 0.0 | | Vehicles | 0 | 16 | 15 | 15 | 15 |
|
|
|
|
|
|
|---|
Subcommittee Table of ContentsProgram: Law Enforcement Function The primary responsibility of this section is to favorably control human interaction with wildlife resources by enforcing state wildlife laws and, through voluntary compliance, seeking protection of resources and orderly use of resources. Officers in the wildlife law enforcement section have all the powers of law enforcement officers throughout the state. Hunter Education teaches safe handling of firearms, respect for wildlife, furbearer education, and ethical hunting practices. The division operates the Lee Kay Center in Salt Lake County and the Cache Valley Center in Logan. One dollar from each hunting license sold goes to fund the Hunter Education program. Funding Detail Sources of Finance
(click linked fund name for more info) | 2009
Actual | 2010
Actual | 2011
Actual | 2012
Actual | 2013
Approp | | General Fund | $2,023,600 | $1,683,700 | $1,683,700 | $2,148,200 | $1,701,600 | | Federal Funds | $472,700 | $546,400 | $679,600 | $784,600 | $562,500 | | GFR - Wildlife Resources | $5,542,200 | $6,344,800 | $6,538,700 | $6,098,000 | $6,577,900 | | Total | $8,038,500 | $8,574,900 | $8,902,000 | $9,030,800 | $8,842,000 |
|---|
| | | | | | Categories of Expenditure
(mouse-over category name for definition) | 2009
Actual | 2010
Actual | 2011
Actual | 2012
Actual | 2013
Approp |
|---|
| Personnel Services | $6,213,600 | $6,380,000 | $6,749,500 | $6,808,500 | $6,743,700 | | In-state Travel | $33,000 | $49,000 | $39,700 | $33,000 | $39,700 | | Out-of-state Travel | $13,900 | $8,300 | $13,200 | $9,700 | $13,200 | | Current Expense | $1,545,200 | $1,783,800 | $1,784,300 | $1,813,000 | $1,732,600 | | DP Current Expense | $170,700 | $244,700 | $201,300 | $191,500 | $198,800 | | Capital Outlay | $62,100 | $95,500 | $14,000 | $46,900 | $14,000 | | Other Charges/Pass Thru | $0 | $13,600 | $100,000 | $128,200 | $100,000 | | Total | $8,038,500 | $8,574,900 | $8,902,000 | $9,030,800 | $8,842,000 |
|---|
| | | | | | | Other Indicators | 2009
Actual | 2010
Actual | 2011
Actual | 2012
Actual | 2013
Approp |
|---|
| Budgeted FTE | 85.0 | 82.0 | 85.0 | 79.0 | 88.5 | | Actual FTE | 80.4 | 85.0 | 88.3 | 88.6 | 0.0 | | Vehicles | 0 | 83 | 84 | 81 | 84 |
|
|
|
|
|
|
|---|
Subcommittee Table of ContentsProgram: Habitat Council Function The Habitat Council is statutorily required to advise the DWR director on habitat issues and recommend uses of monies in the General Fund Restricted -- Wildlife Habitat Account. The Habitat Council reviews all habitat and sportsmen access project proposals that are funded by the Wildlife Habitat Account. Funding Detail The revenue for the Wildlife Habitat Restricted Account comes primarily from sale of licenses. Sources of Finance
(click linked fund name for more info) | 2009
Actual | 2010
Actual | 2011
Actual | 2012
Actual | 2013
Approp | | Federal Funds | $422,200 | $121,700 | $282,800 | $82,500 | $121,700 | | GFR - Wildlife Habitat | $2,758,900 | $2,700,000 | $2,900,000 | $2,900,000 | $2,900,000 | | Beginning Nonlapsing | $703,900 | $300,000 | $0 | $0 | $0 | | Closing Nonlapsing | ($300,000) | $0 | $0 | $0 | $0 | | Lapsing Balance | ($276,500) | ($634,100) | ($580,600) | ($382,500) | $0 | | Total | $3,308,500 | $2,487,600 | $2,602,200 | $2,600,000 | $3,021,700 |
|---|
| | | | | | Categories of Expenditure
(mouse-over category name for definition) | 2009
Actual | 2010
Actual | 2011
Actual | 2012
Actual | 2013
Approp |
|---|
| Personnel Services | $448,400 | $535,800 | $541,300 | $394,600 | $0 | | In-state Travel | $3,900 | $3,700 | $6,600 | $12,600 | $6,600 | | Out-of-state Travel | $8,900 | $0 | $800 | $3,900 | $800 | | Current Expense | $1,748,000 | $989,700 | $1,465,000 | $1,320,500 | $1,454,200 | | DP Current Expense | $200 | $1,300 | $19,300 | $100 | $19,300 | | DP Capital Outlay | $1,400 | $0 | $0 | $0 | $0 | | Capital Outlay | $890,900 | $690,500 | $88,400 | $471,800 | $88,400 | | Other Charges/Pass Thru | $206,800 | $266,600 | $480,800 | $396,500 | $1,452,400 | | Total | $3,308,500 | $2,487,600 | $2,602,200 | $2,600,000 | $3,021,700 |
|---|
| | | | | | | Other Indicators | 2009
Actual | 2010
Actual | 2011
Actual | 2012
Actual | 2013
Approp |
|---|
| Budgeted FTE | 0.0 | 0.0 | 0.0 | 0.0 | 0.0 |
|
|
|
|
|
|
|---|
Subcommittee Table of ContentsProgram: Habitat Section Function The Habitat Section focuses on analyzing resource development impacts, acquiring and managing fish and wildlife habitat, staffing the Habitat Council process, developing and maintaining a central database on fish, wildlife and plants, administering the division's GIS program, and running the range inventory program and Great Basin Research Center. The remainder of the section coordinates regional planning efforts and serves as liaison with federal conservation programs. The Section seeks to conserve and restore wildlife habitats. The staff identifies high value wildlife areas in Utah in an effort to help landowners, decision makers, and others address issues posed by open space management. The Habitat Section is also responsible for the lands owned by the division. Funding Detail Sources of Finance
(click linked fund name for more info) | 2009
Actual | 2010
Actual | 2011
Actual | 2012
Actual | 2013
Approp | | General Fund | $211,100 | $177,100 | $177,100 | $141,100 | $126,100 | | Federal Funds | $1,319,100 | $1,404,600 | $2,817,100 | $1,310,900 | $2,193,400 | | GFR - Wildlife Resources | $3,761,600 | $2,099,700 | $3,115,600 | $3,111,300 | $1,951,800 | | Total | $5,291,800 | $3,681,400 | $6,109,800 | $4,563,300 | $4,271,300 |
|---|
| | | | | | Categories of Expenditure
(mouse-over category name for definition) | 2009
Actual | 2010
Actual | 2011
Actual | 2012
Actual | 2013
Approp |
|---|
| Personnel Services | $3,253,900 | $3,472,900 | $3,499,700 | $3,531,500 | $3,711,800 | | In-state Travel | $24,000 | $24,000 | $20,800 | $31,700 | $20,800 | | Out-of-state Travel | $4,300 | $4,600 | $12,700 | $10,300 | $12,700 | | Current Expense | $1,224,400 | ($199,800) | $1,122,900 | $652,800 | $422,900 | | DP Current Expense | $108,000 | $95,600 | $99,200 | $101,800 | $98,500 | | DP Capital Outlay | ($207,100) | $0 | $0 | $0 | $0 | | Capital Outlay | $823,200 | $149,500 | $0 | $6,200 | $0 | | Other Charges/Pass Thru | $61,100 | $134,900 | $1,354,500 | $229,000 | $4,600 | | Cost Accounts | $0 | ($300) | $0 | $0 | $0 | | Total | $5,291,800 | $3,681,400 | $6,109,800 | $4,563,300 | $4,271,300 |
|---|
| | | | | | | Other Indicators | 2009
Actual | 2010
Actual | 2011
Actual | 2012
Actual | 2013
Approp |
|---|
| Budgeted FTE | 64.0 | 61.0 | 63.0 | 78.0 | 72.0 | | Actual FTE | 84.2 | 84.0 | 83.1 | 79.4 | 0.0 | | Vehicles | 0 | 60 | 57 | 58 | 57 |
|
|
|
|
|
|
|---|
Subcommittee Table of ContentsProgram: Wildlife Section Function The Wildlife Section is responsible for the terrestrial wildlife management programs in the division. It manages and conserves over 350 species of wildlife including non-game birds and small mammals, threatened and endangered species, upland game species, furbearers, cougar, bear, big game and waterfowl. The section also addresses the needs of sportsmen, private landowners and the general public through falconry, Dedicated Hunter, Cooperative Wildlife Management Units, and depredation management programs. Regional wildlife biologists implement strategies to achieve wildlife goals and objectives planned by program coordinators and detailed in species management plans such as those enacted for deer and elk. Biologists conduct surveys and closely monitor wildlife populations and habitat conditions throughout the state. They make recommendations to the Wildlife Board for the prudent harvest of game species and the conservation of native wildlife. Efforts are made to help private landowners mitigate wildlife problems by providing landowner programs that allow special hunting permit opportunities and by helping to mitigate damages that result from wildlife doing damage to crops or livestock. Funding Detail Sources of Finance
(click linked fund name for more info) | 2009
Actual | 2010
Actual | 2011
Actual | 2012
Actual | 2013
Approp | | General Fund | $756,900 | $587,000 | $587,000 | $480,300 | $778,300 | | Federal Funds | $3,579,100 | $3,756,100 | $4,467,000 | $4,080,800 | $5,866,700 | | GFR - Wildlife Resources | $3,511,200 | $3,266,100 | $3,022,400 | $2,701,900 | $4,429,000 | | GFR - Mule Deer Protection Account | $0 | $0 | $0 | $0 | $500,000 | | GFR - Predator Control | $0 | $0 | $0 | $0 | $600,000 | | Beginning Nonlapsing | $108,000 | $0 | $0 | $0 | $0 | | Total | $7,955,200 | $7,609,200 | $8,076,400 | $7,263,000 | $12,174,000 |
|---|
| | | | | | Categories of Expenditure
(mouse-over category name for definition) | 2009
Actual | 2010
Actual | 2011
Actual | 2012
Actual | 2013
Approp |
|---|
| Personnel Services | $4,531,100 | $4,733,400 | $4,610,400 | $4,075,500 | $4,985,400 | | In-state Travel | $54,700 | $58,000 | $43,300 | $60,400 | $43,300 | | Out-of-state Travel | $20,800 | $11,900 | $19,600 | $19,700 | $19,600 | | Current Expense | $2,082,200 | $2,045,300 | $2,061,200 | $1,782,400 | $3,125,100 | | DP Current Expense | $100,500 | $98,400 | $106,200 | $105,800 | $106,200 | | Capital Outlay | $83,100 | $1,600 | $79,800 | $0 | $79,800 | | Other Charges/Pass Thru | $1,082,800 | $657,100 | $1,155,900 | $1,219,200 | $3,814,600 | | Cost Accounts | $0 | $3,500 | $0 | $0 | $0 | | Total | $7,955,200 | $7,609,200 | $8,076,400 | $7,263,000 | $12,174,000 |
|---|
| | | | | | | Other Indicators | 2009
Actual | 2010
Actual | 2011
Actual | 2012
Actual | 2013
Approp |
|---|
| Budgeted FTE | 76.0 | 75.0 | 76.0 | 80.0 | 76.0 | | Actual FTE | 88.3 | 93.0 | 88.8 | 75.1 | 0.0 | | Vehicles | 0 | 106 | 102 | 96 | 102 |
|
|
|
|
|
|
|---|
Subcommittee Table of ContentsProgram: Aquatic Section Function The Aquatic Section manages and conserves fish, amphibians, reptiles, and crustaceans (e.g., brine shrimp and crayfish) in the state. Aquatic Section personnel monitor population and habitat trends, and conduct studies necessary to make management decisions. Recommendations are formulated and presented to the Wildlife Board for regulating recreational and commercial fishing and collection, possession, and importation of aquatic wildlife. The Aquatic Section also manages the Aquatic Education function. State Fish Hatcheries The state hatchery system usually produces and distributes about 8 million fish per year for a total of 1.1 million pounds of fish. Many of these are planted as fingerlings while about 1.5 million fish are planted as catchable sized fish. More than 26 million eggs are taken from hatcheries (over 24 million) and wild stocks (over 2 million). Most eggs are supplied to state hatcheries. However, some of the eggs are sent to other states and federal hatcheries in exchange for other kinds of fish and eggs needed in Utah. Native Species The Native Species program manages native aquatic wildlife, including fish, amphibians, reptiles, mollusks, and brine shrimp. This program provides conservation, protection, and enhancement efforts to ensure the continued existence of native species while providing recreational and aesthetic values to the public. Funding Detail Sources of Finance
(click linked fund name for more info) | 2009
Actual | 2010
Actual | 2011
Actual | 2012
Actual | 2013
Approp | | General Fund | $1,715,900 | $1,317,400 | $1,317,400 | $1,334,300 | $1,060,500 | | Federal Funds | $6,326,800 | $4,984,800 | $5,985,100 | $4,991,400 | $7,240,300 | | GFR - Wildlife Resources | $5,132,900 | $5,878,100 | $5,295,700 | $5,136,700 | $7,299,400 | | Total | $13,175,600 | $12,180,300 | $12,598,200 | $11,462,400 | $15,600,200 |
|---|
| | | | | | Categories of Expenditure
(mouse-over category name for definition) | 2009
Actual | 2010
Actual | 2011
Actual | 2012
Actual | 2013
Approp |
|---|
| Personnel Services | $8,099,600 | $7,088,400 | $7,556,300 | $7,003,800 | $7,835,800 | | In-state Travel | $44,200 | $47,500 | $41,500 | $41,000 | $41,500 | | Out-of-state Travel | $25,000 | $15,000 | $16,000 | $17,200 | $16,000 | | Current Expense | $3,631,300 | $3,319,400 | $3,037,500 | $3,267,800 | $3,213,500 | | DP Current Expense | $177,100 | $154,100 | $204,400 | $153,700 | $203,700 | | DP Capital Outlay | $0 | ($3,000) | $0 | $0 | $0 | | Capital Outlay | $159,800 | $925,800 | $70,300 | $14,800 | $70,300 | | Other Charges/Pass Thru | $1,040,500 | $633,400 | $1,672,200 | $964,100 | $4,219,400 | | Cost Accounts | ($1,900) | ($300) | $0 | $0 | $0 | | Total | $13,175,600 | $12,180,300 | $12,598,200 | $11,462,400 | $15,600,200 |
|---|
| | | | | | | Other Indicators | 2009
Actual | 2010
Actual | 2011
Actual | 2012
Actual | 2013
Approp |
|---|
| Budgeted FTE | 122.0 | 120.0 | 122.0 | 139.0 | 129.5 | | Actual FTE | 158.1 | 167.0 | 169.9 | 159.6 | 0.0 | | Vehicles | 0 | 149 | 143 | 137 | 143 |
|
|
|
|
|
|
|---|
Subcommittee Table of Contents |