Agency: Natural Resources Line Item: Contributed Research Function The funding for the Contributed Research line item comes from a variety of sources, including the proceeds from the sale of hunting conservation permits, the Help Stop Poaching program, and donations by businesses, cities, and non-profit organizations. The primary use of these funds is for habitat projects, transplants, specific research, and other efforts directed to help wildlife.
Performance This measure tracks the funding contributed to this line item. 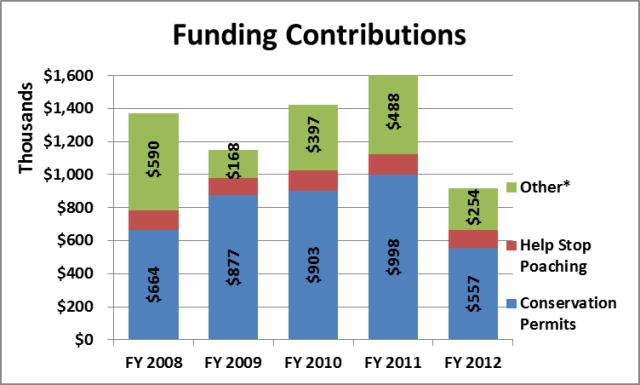 *Includes: Blue Ribbon Fisheries Contributions, Trout Unlimited, Safari Club, Cities and Towns for Community Fisheries, etc. *Includes: Blue Ribbon Fisheries Contributions, Trout Unlimited, Safari Club, Cities and Towns for Community Fisheries, etc.Funding Detail Examples of major contributions for FY 2012 came from the following sources: - Conservation Permits: 812,600 (Mule Deer Foundation, Sportsmen for Fish and Wildlife, etc.),
- Help Stop Poaching: $39,000 (Awarded by courts in addition to the Fine Imposed),
- Urban Fisheries Program: 25,000.
Sources of Finance
(click linked fund name for more info) | 2009
Actual | 2010
Actual | 2011
Actual | 2012
Actual | 2013
Approp | | Dedicated Credits Revenue | $1,150,100 | $1,424,000 | $1,610,700 | $915,900 | $830,900 | | Total | $1,150,100 | $1,424,000 | $1,610,700 | $915,900 | $830,900 |
|---|
| | | | | | Programs:
(click linked program name to drill-down) | 2009
Actual | 2010
Actual | 2011
Actual | 2012
Actual | 2013
Approp |
|---|
| Contributed Research | $1,150,100 | $1,424,000 | $1,610,700 | $915,900 | $830,900 | | Total | $1,150,100 | $1,424,000 | $1,610,700 | $915,900 | $830,900 |
|---|
| | | | | | Categories of Expenditure
(mouse-over category name for definition) | 2009
Actual | 2010
Actual | 2011
Actual | 2012
Actual | 2013
Approp |
|---|
| Personnel Services | $112,000 | $201,400 | $203,900 | $70,300 | $0 | | In-state Travel | $600 | $5,100 | $3,100 | $1,700 | $200 | | Out-of-state Travel | $4,500 | $5,100 | $0 | $0 | $0 | | Current Expense | $794,100 | $854,500 | $1,123,200 | $665,000 | $583,600 | | DP Current Expense | $13,900 | $9,600 | $0 | $500 | $0 | | DP Capital Outlay | $26,700 | $0 | $0 | $0 | $0 | | Capital Outlay | $132,300 | $0 | $27,800 | $0 | $0 | | Other Charges/Pass Thru | $66,000 | $348,300 | $252,700 | $178,400 | $247,100 | | Total | $1,150,100 | $1,424,000 | $1,610,700 | $915,900 | $830,900 |
|---|
| | | | | | | Other Indicators | 2009
Actual | 2010
Actual | 2011
Actual | 2012
Actual | 2013
Approp |
|---|
| Budgeted FTE | 1.5 | 2.0 | 1.3 | 0.0 | 0.0 |
|
|
|
|
|
|
|---|
Subcommittee Table of Contents |