Compendium of Budget Information for the 2013 General Session
| Business, Economic Development, & Labor Appropriations Subcommittee | ||||||||||||||||||||||||||||||||||||||||||||||||||||||||||||||||||||||||||||||||||||||||||||||||||||||||||||||||||||||||||||||||||||||||||||||||||||||||||||||||||||||||||||||||||||||||||||||||||||||||||||||||||||||||||||||||||||||||||||||||||||||||||||||||||||||||||||||||||||||||||||||||||||||||||||||||||||||||||||||||||||||||||||||||||||||||||||||||||||||||||||||||||||||||||||||||||||||||||||||||||||||||||||||||||||||||||||||||||||||||||||||||||||||||||||||||||||||||||||||||||||||||||||||||||||||||||||||||||||||||||||||||||||||||||||||||||||||||||||||||||||
| <-Previous Page | Subcommittee Table of Contents | Next Page-> | ||||||||||||||||||||||||||||||||||||||||||||||||||||||||||||||||||||||||||||||||||||||||||||||||||||||||||||||||||||||||||||||||||||||||||||||||||||||||||||||||||||||||||||||||||||||||||||||||||||||||||||||||||||||||||||||||||||||||||||||||||||||||||||||||||||||||||||||||||||||||||||||||||||||||||||||||||||||||||||||||||||||||||||||||||||||||||||||||||||||||||||||||||||||||||||||||||||||||||||||||||||||||||||||||||||||||||||||||||||||||||||||||||||||||||||||||||||||||||||||||||||||||||||||||||||||||||||||||||||||||||||||||||||||||||||||||||||||||||||||||||||
Line Item: Insurance Department Administration Function Administration coordinates with all programs in the Department and is responsible for budgeting, accounting, financial tracking, personnel, actuarial services, and managerial statistics. Producer Licensing is responsible for the issuance and renewal of licenses to all Utah insurance agents and agencies. Licensees qualify through examination. The Financial Examination Division licenses approximately 1,700 insurance companies in Utah. It also monitors the financial strength and solvency of those companies. The division is responsible for the financial examination of insurers according to statute. Because not all of the companies are headquartered in Utah, the examiners may spend their time out of state. The Insurance Department is reimbursed by the insurer being examined for all costs incurred during the examination, which includes examiners salaries, benefits and travel expenses. These reimbursements are deposited into the Insurance Department Restricted Account. The Property and Casualty and Health and Life Divisions function by line of insurance. These divisions handle telephone, online and walk-in complaints and inquiries from the public regarding insurance products. Additionally, they review and analyze policy forms and rates filed by insurance companies. The Health and Life Division operates a federal grant "Grants to Support States in Health Insurance Rate Review Grant Cycle II". This division also supports the call center for Avenue H, Utah's health insurance exchange. Market Conduct Division investigates and enforces insurance code violations referred from the insurance industry and other divisions of the department. Intent Language It is the intent of the Legislature to allow State Fleet Services to purchase one additional fleet vehicle for Insurance Fraud investigations with division funds. Performance The Insurance Department uses the following performance measures: consumer inquiries/complaints received, financial exams conducted, fraud cases opened, fraud cases completed, captive insurers licenses issued, and the number of active captive insurers. Data is shown below. 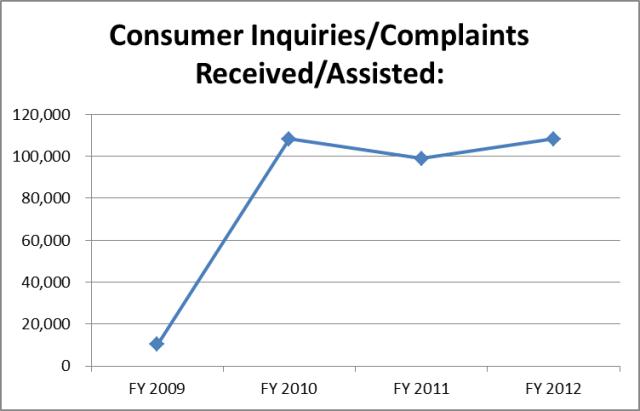 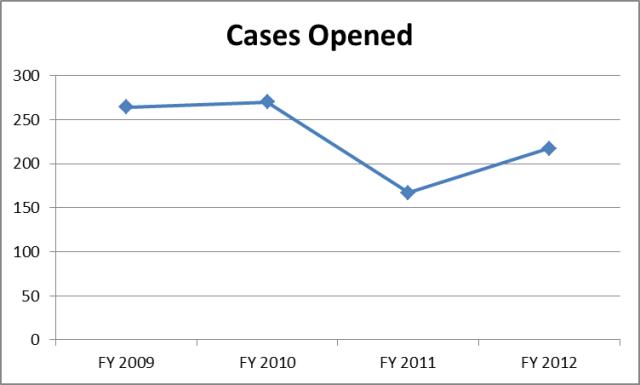 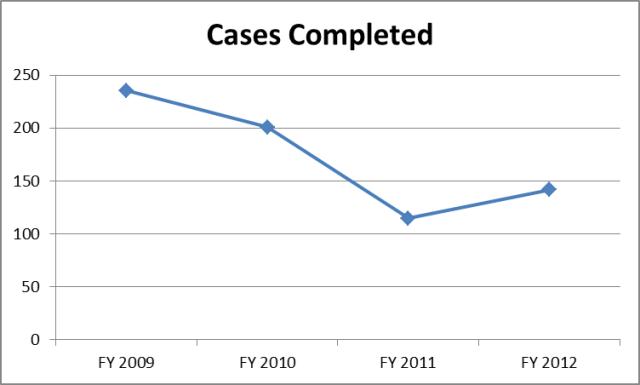 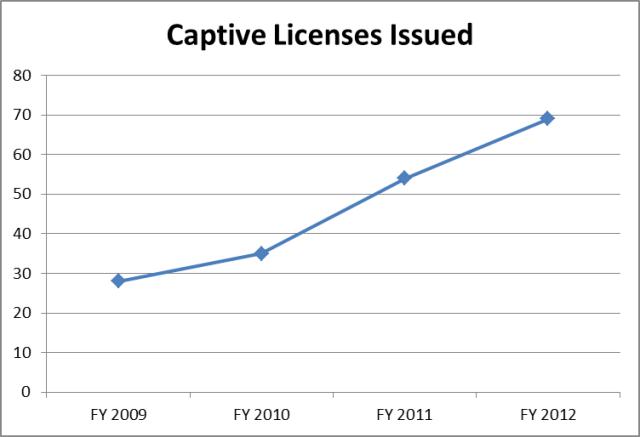 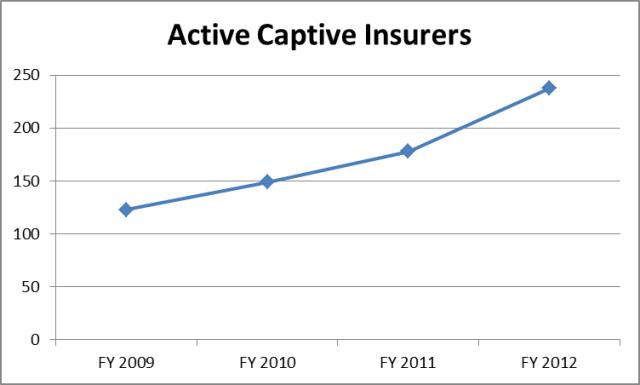 Funding Detail For more detail about a particular source of finance or organizational unit, click a linked entry in the left column of the table(s) below.
Function Under UCA 31A-22-307, the Relative Value Study is to determine the reasonable value of medical expenses. It is funded by a 0.01 percent tax on motor vehicle liability, uninsured motorist, and personal injury protection insurance premiums. Funds are collected by the Tax Commission as restricted funds in the Relative Value Study Restricted Account. The study is produced by the All-Payer Claims Data Base in the Office of Health Care Statistics in the Department of Health. The contract to produce the study is re-bid every three years. The department charges $10 per copy. Funding Detail
Program: Insurance Fraud Program Function The 1994 Legislature created the Insurance Fraud Act (UCA 31A-31-101 through 111) and subsequently the department created the Insurance Fraud Division. It conducts criminal investigations and prosecutes insurance fraud violators. Nationwide, insurance fraud is estimated at over $30 billion per year in property and casualty claims. For healthcare fraud the nationwide losses are estimated to be at least $77 billion and possibly reaching over $250 billion. The program is funded by the Insurance Fraud Investigation Restricted Account. Funding Detail Funding for the Insurance Fraud program is from the Insurance Fraud Investigation Restricted Account. Funds are used mainly for staff and corresponding current expense costs. Restitution payments are also made from the Fraud program as ordered by the Courts to victims of fraud insurance.
Program: Electronic Commerce Fee Function The Captive Insurance Division was created in 2003 when the Captive Insurance Companies Act (UCA 31A-37-101 through 604) was passed by the Legislature. The division licenses captive insurance companies formed by companies to manage their risk exposure. It also monitors their solvency and financial strength. The division is funded by the Captive Insurance Restricted Account. As of June 30, 2012, the division was regulating 238 Utah domiciled companies. Funding Detail Since FY 2011, funding for the Captive Insurers program has been from the Captive Insurance Restricted Account, (H.B. 39 Insurance Related Amendments, 2010 General Session) and is used to fund all aspects of the program, including: personnel, audits and other supports for accomplishing the mission of the Captive Insurers program.
| ||||||||||||||||||||||||||||||||||||||||||||||||||||||||||||||||||||||||||||||||||||||||||||||||||||||||||||||||||||||||||||||||||||||||||||||||||||||||||||||||||||||||||||||||||||||||||||||||||||||||||||||||||||||||||||||||||||||||||||||||||||||||||||||||||||||||||||||||||||||||||||||||||||||||||||||||||||||||||||||||||||||||||||||||||||||||||||||||||||||||||||||||||||||||||||||||||||||||||||||||||||||||||||||||||||||||||||||||||||||||||||||||||||||||||||||||||||||||||||||||||||||||||||||||||||||||||||||||||||||||||||||||||||||||||||||||||||||||||||||||||||
| <-Previous Page | Next Page-> |
COBI contains unaudited data as presented to the Legislature by state agencies at the time of publication. For audited financial data see the State of Utah's Comprehensive Annual Financial Reports.