Foreword The Utah Legislature's Compendium of Budget Information (COBI) is a reference document in which you will find detail on Utah state government activities. It includes program descriptions, references to statutory authority, performance measures, intent language, and, of course, budget data. COBI sets a baseline against which citizens and policymakers can evaluate budgets proposed during the 2013 General Session.
COBI is one part of a three-pronged approach to staff budget analysis. Parts two and three of the Legislature's budget analysis -- Budget Briefs and Issue Briefs -- will be available throughout the 2013 General Session beginning in January. Both are succinct, decision oriented papers that build on COBI, presenting future budget options rather than COBI's status quo. Budget Briefs follow the structure of state appropriations, documenting proposals for current year supplemental and future year budget action. Issue Briefs cut across "silos" to discuss subjects that impact state appropriations independent of program structure. Utah is unique in that all legislators serve on the Joint Appropriations Committee. That committee is divided into eight issue-oriented appropriations subcommittees. The subcommittees are:
COBI is organized around these subcommittees - plus the Executive Appropriations Committee (EAC). To drill-down into agency, line-item, and program budgets covered by a particular subcommittee or by EAC, you may click on the committee names in the tables below, go to our Statewide Table of Contents, or use the navigation links at the top and bottom of each page. Figures 1 and 2 below reflect the state budget from all sources first by source of finance and then by area of spending. These figures, and the total budget table below, include operating and capital budgets (Table 1) plus any appropriation to a fund or account from which state agencies can spend without further appropriation (Table 2) . Detailed numbers behind these charts are included in the "2013 Approp" column of the budget tables herein. 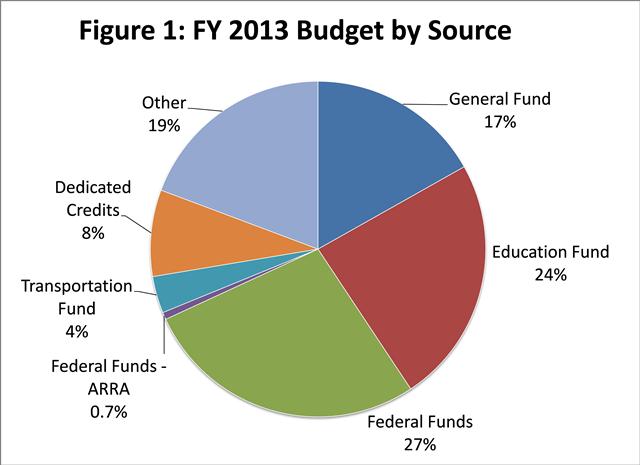 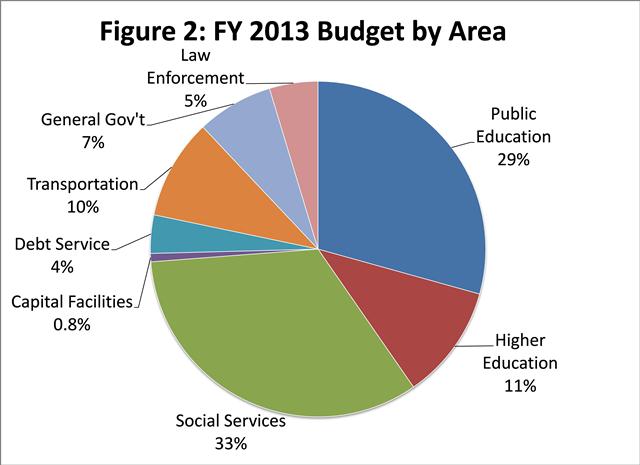
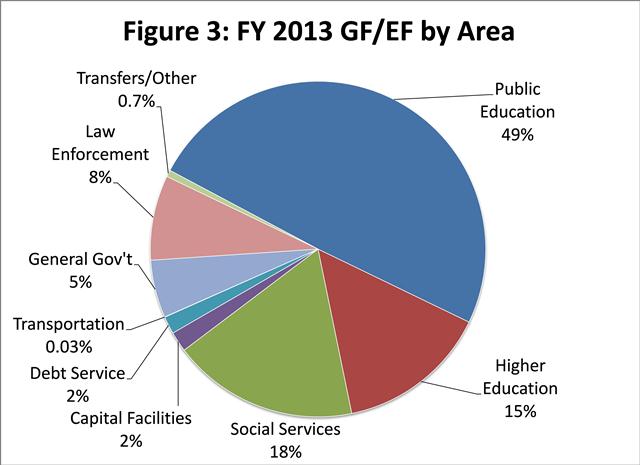
When discussing the state budget, policymakers also frequently refer to appropriations from the General and Education Funds. They do so because, while the General and Education Funds make-up less than half of total appropriations, the revenue in these funds comes mostly from sales and income taxes. Unlike other more restricted revenue sources, lawmakers have some discretion on how to spend the General and Education Funds. General and Education Fund appropriations by area of spending are shown in figure 3 below.
 Appropriations acts include more than just the operating, capital, and expendable fund appropriations. They also authorize state agencies and the state Division of Finance to operate Internal Service and Enterprise funds (Table 3), move money among funds (Table 4), and sweep fund and account balances into the General and Education funds (Table 5). The Legislature further includes in appropriations acts certain trust funds that it has reviewed (Table 6). Transfers among and within agencies complicate the "total budget" picture. Medicaid is the biggest and best example of this. The Department of Health is designated by federal regulation as Utah's single state agent for administering Medicaid. As such, the Department of Health collects and distributes all Medicaid funds. However, other state agencies implement some Medicaid programs. As agencies transfer Medicaid funds from one department to another, the expenditures are recorded in each agency's books, which can over-state expenditures when agencies are summed. These transactions are eliminated in Utah's annual financial statements, but they are not eliminated from "total budget" numbers. In an ongoing effort, the Office of the Legislative Fiscal Analyst is attempting to identify all interagency transfers included in the total budget so that we can better estimate the size of government. For the 2013 COBI, we have been able to identify and reconcile interagency transfers associated with Higher Education and Medicaid (Table 8). Remaining unreconciled transfers will be examined and isolated or eliminated in future reports. Utah State Budget Summary For more detail about a particular source of finance or organizational unit, click a linked entry in the left column of the tables below. Table 1: Operating and Capital Budget Including Transfers to Expendable Funds and Accounts Sources of Finance
(click linked fund name for more info) | 2009
Actual | 2010
Actual | 2011
Actual | 2012
Actual | 2013
Approp | | General Fund | $1,960,708,550 | $1,832,844,050 | $2,000,669,450 | $1,992,063,550 | $2,063,302,100 | | General Fund, One-time | $158,972,600 | ($20,056,200) | $57,709,100 | $106,939,000 | $58,897,400 | | Education Fund | $384,367,200 | $350,937,400 | $2,675,594,686 | $2,710,794,991 | $2,896,688,300 | | Education Fund, One-time | ($74,259,100) | ($80,684,300) | ($70,371,000) | $4,696,600 | $43,075,000 | | Uniform School Fund | $2,332,619,286 | $2,178,256,186 | $19,000,000 | $19,000,000 | $16,000,000 | | Uniform School Fund, One-time | $76,204,600 | $181,836,700 | $30,000,000 | $12,000,000 | $45,000,000 | | Transportation Fund | $443,315,400 | $492,114,000 | $376,826,300 | $403,765,400 | $446,900,000 | | General Fund Restricted | $280,922,500 | $278,360,500 | $270,060,100 | $307,953,800 | $314,859,100 | | Education Special Revenue | $28,375,100 | $26,215,000 | $25,192,800 | $28,425,400 | $25,325,300 | | Transportation Special Revenue | $50,865,400 | $56,890,700 | $60,338,600 | $60,852,100 | $61,011,900 | | Federal Funds | $2,888,211,300 | $3,224,999,700 | $3,423,855,100 | $3,554,534,600 | $3,462,032,700 | | Federal Funds - ARRA | $315,719,400 | $441,610,600 | $241,293,800 | $45,068,300 | $86,979,200 | | Dedicated Credits | $913,661,400 | $1,004,941,900 | $1,087,847,300 | $1,189,558,000 | $1,056,105,100 | | Land Grant | $1,303,100 | $1,386,400 | $1,297,400 | $1,666,100 | $1,110,100 | | Federal Mineral Lease | $165,533,700 | $123,028,300 | $132,577,300 | $145,760,300 | $154,079,400 | | Special Revenue | $5,283,200 | $4,291,300 | $36,557,000 | $58,622,900 | $46,010,300 | | Private Purpose Trust Funds | $4,362,200 | $4,278,400 | $2,796,100 | $2,787,700 | $2,837,800 | | Capital Project Funds | $620,985,200 | $411,030,800 | $358,877,200 | $329,927,600 | $755,134,800 | | Internal Service Funds | $119,900 | $0 | $0 | $0 | $0 | | Enterprise Funds | $111,721,300 | $105,386,000 | $106,047,700 | $147,836,500 | $138,977,500 | | Transfers | $118,379,600 | $104,319,800 | $24,544,657 | $39,078,700 | $60,845,400 | | Transfers - Medicaid | $313,654,200 | $315,487,900 | $274,523,143 | $271,676,500 | $290,219,500 | | Transfers - Higher Education | $20,044,800 | $9,526,400 | $7,259,100 | $7,852,100 | $7,235,200 | | Other Financing Sources | $619,647,074 | $630,438,570 | $662,986,600 | $654,365,500 | $631,117,100 | | Pass-through | $6,937,800 | $4,434,300 | $5,164,100 | $3,791,600 | $2,992,600 | | Beginning Balance | $816,790,500 | $832,452,600 | $856,778,900 | $947,101,300 | $113,363,400 | | Closing Balance | ($798,417,300) | ($881,452,400) | ($936,801,300) | ($1,069,245,300) | ($105,871,900) | | Lapsing Balance | ($33,954,000) | ($63,791,400) | ($49,128,100) | ($43,076,000) | ($2,660,500) | | Total | $11,732,074,910 | $11,569,083,206 | $11,681,496,036 | $11,933,797,241 | $12,671,566,800 |
|---|
| | | | | | Committees
(click linked committee name to drill-down) | 2009
Actual | 2010
Actual | 2011
Actual | 2012
Actual | 2013
Approp |
|---|
| Executive Offices & Criminal Justice | $741,733,250 | $716,302,850 | $724,495,950 | $738,633,250 | $775,838,400 | | Infrastructure & General Government | $2,026,651,500 | $1,771,190,900 | $1,612,851,700 | $1,640,966,100 | $1,842,895,200 | | Business, Economic Development, & Labor | $286,937,000 | $277,814,700 | $286,650,500 | $316,770,400 | $384,049,200 | | Social Services | $3,447,417,700 | $3,715,149,200 | $3,776,339,700 | $3,932,034,500 | $4,200,483,100 | | Higher Education | $1,269,436,100 | $1,264,602,600 | $1,321,198,100 | $1,362,920,900 | $1,351,669,100 | | Natural Resources, Agriculture, & Environmental Quality | $286,070,100 | $266,986,300 | $284,897,400 | $265,714,800 | $288,222,100 | | Public Education | $3,563,970,560 | $3,457,622,456 | $3,577,936,786 | $3,554,083,791 | $3,690,637,900 | | Retirement & Independent Entities | $36,164,100 | $35,019,800 | $36,177,700 | $45,355,400 | $41,880,600 | | Executive Appropriations | $73,694,600 | $64,394,400 | $60,948,200 | $77,318,100 | $95,891,200 | | Total | $11,732,074,910 | $11,569,083,206 | $11,681,496,036 | $11,933,797,241 | $12,671,566,800 |
|---|
| | | | | | Categories of Expenditure
(mouse-over category name for definition) | 2009
Actual | 2010
Actual | 2011
Actual | 2012
Actual | 2013
Approp |
|---|
| Personnel Services | $2,389,617,250 | $2,314,605,100 | $2,345,517,000 | $2,379,641,800 | $2,482,040,070 | | In-state Travel | $17,150,100 | $15,967,800 | $18,303,400 | $18,818,400 | $13,007,000 | | Out-of-state Travel | $5,739,600 | $4,727,600 | $4,793,300 | $6,085,100 | $5,403,500 | | Current Expense | $1,024,980,200 | $1,120,674,800 | $1,175,545,950 | $1,291,943,100 | $1,378,254,430 | | DP Current Expense | $165,246,100 | $142,161,900 | $149,128,700 | $153,224,200 | $144,945,300 | | DP Capital Outlay | $12,588,000 | $15,014,500 | $16,297,500 | $16,766,900 | $23,886,200 | | Capital Outlay | $1,135,267,400 | $958,643,000 | $596,153,800 | $656,405,000 | $666,092,200 | | Other Charges/Pass Thru | $6,778,248,160 | $6,735,928,306 | $7,153,411,286 | $7,103,379,491 | $7,641,825,700 | | Cost of Goods Sold | ($191,000) | $248,800 | ($285,000) | $70,400 | $0 | | Cost Accounts | $2,300 | $5,400 | $4,300 | $118,700 | $0 | | Transfers | $81,902,400 | $139,507,900 | $98,435,700 | $182,766,300 | $186,869,400 | | Trust & Agency Disbursements | $121,524,400 | $121,609,300 | $124,199,500 | $124,577,900 | $129,243,000 | | Total | $11,732,074,910 | $11,569,094,406 | $11,681,505,436 | $11,933,797,291 | $12,671,566,800 |
|---|
| | | | | | | Other Indicators | 2009
Actual | 2010
Actual | 2011
Actual | 2012
Actual | 2013
Approp |
|---|
| Budgeted FTE | 34,477.4 | 34,019.6 | 33,034.4 | 31,977.7 | 33,752.3 | | Vehicles | 7,291 | 7,120 | 7,084 | 7,095 | 7,132 |
|
|
|
|
|
|
|---|
Statewide Table of Contents
Table 2 - Operating and Capital Budgets Sources of Finance
(click linked fund name for more info) | 2009
Actual | 2010
Actual | 2011
Actual | 2012
Actual | 2013
Approp | | General Fund | $1,958,072,150 | $1,830,562,150 | $1,998,426,550 | $1,989,820,650 | $2,061,059,200 | | General Fund, One-time | $158,422,600 | ($20,070,000) | $57,709,100 | $95,666,000 | $58,797,400 | | Education Fund | $384,367,200 | $350,937,400 | $2,675,594,686 | $2,710,794,991 | $2,896,688,300 | | Education Fund, One-time | ($74,259,100) | ($80,684,300) | ($70,371,000) | $4,696,600 | $43,075,000 | | Uniform School Fund | $2,332,619,286 | $2,178,256,186 | $19,000,000 | $19,000,000 | $16,000,000 | | Uniform School Fund, One-time | $76,204,600 | $181,836,700 | $30,000,000 | $12,000,000 | $45,000,000 | | Transportation Fund | $443,315,400 | $492,114,000 | $376,826,300 | $403,765,400 | $446,900,000 | | General Fund Restricted | $274,066,800 | $273,143,600 | $266,222,200 | $281,089,000 | $307,359,100 | | Education Special Revenue | $28,375,100 | $26,215,000 | $25,192,800 | $28,425,400 | $25,325,300 | | Transportation Special Revenue | $50,865,400 | $56,890,700 | $60,338,600 | $60,852,100 | $61,011,900 | | Federal Funds | $2,882,607,600 | $3,214,218,800 | $3,418,885,200 | $3,546,019,400 | $3,456,207,700 | | Federal Funds - ARRA | $315,719,400 | $441,610,600 | $241,293,800 | $45,068,300 | $86,979,200 | | Dedicated Credits | $887,914,600 | $958,421,300 | $1,069,388,300 | $1,125,820,000 | $1,049,883,200 | | Land Grant | $1,303,100 | $1,386,400 | $1,297,400 | $1,666,100 | $1,110,100 | | Federal Mineral Lease | $87,483,600 | $66,103,800 | $70,603,700 | $78,582,400 | $87,779,400 | | Special Revenue | $5,283,200 | $4,291,300 | $36,557,000 | $58,622,900 | $46,010,300 | | Private Purpose Trust Funds | $4,362,200 | $4,278,400 | $2,796,100 | $2,787,700 | $2,837,800 | | Capital Project Funds | $620,985,200 | $411,030,800 | $358,877,200 | $329,927,600 | $755,134,800 | | Internal Service Funds | $119,900 | $0 | $0 | $0 | $0 | | Enterprise Funds | $111,721,300 | $105,386,000 | $106,047,700 | $147,836,500 | $138,977,500 | | Transfers | $118,379,600 | $104,319,800 | $24,544,657 | $39,383,900 | $60,845,400 | | Transfers - Medicaid | $313,654,200 | $315,487,900 | $274,523,143 | $271,676,500 | $290,219,500 | | Transfers - Higher Education | $20,044,800 | $9,526,400 | $7,259,100 | $7,852,100 | $7,235,200 | | Other Financing Sources | $619,647,074 | $630,438,570 | $662,986,600 | $654,365,500 | $631,117,100 | | Pass-through | $6,937,800 | $4,434,300 | $5,164,100 | $3,791,600 | $2,992,600 | | Beginning Balance | $301,570,400 | $266,669,500 | $278,168,100 | $346,695,300 | $112,132,200 | | Closing Balance | ($232,634,200) | ($302,841,600) | ($336,395,300) | ($405,707,400) | ($104,446,200) | | Lapsing Balance | ($33,954,000) | ($63,791,400) | ($49,128,100) | ($43,076,000) | ($2,660,500) | | Total | $11,663,195,210 | $11,460,172,306 | $11,611,807,936 | $11,817,422,541 | $12,583,571,500 |
|---|
| | | | | | Committees
(click linked committee name to drill-down) | 2009
Actual | 2010
Actual | 2011
Actual | 2012
Actual | 2013
Approp |
|---|
| Executive Offices & Criminal Justice | $730,004,150 | $706,623,550 | $714,611,450 | $728,231,450 | $775,838,400 | | Infrastructure & General Government | $2,026,651,500 | $1,771,190,900 | $1,612,851,700 | $1,640,966,100 | $1,842,895,200 | | Business, Economic Development, & Labor | $276,443,800 | $267,111,300 | $278,082,100 | $305,639,900 | $379,271,800 | | Social Services | $3,404,686,700 | $3,628,354,300 | $3,725,960,900 | $3,837,767,700 | $4,117,665,200 | | Higher Education | $1,269,436,100 | $1,264,602,600 | $1,321,198,100 | $1,362,920,900 | $1,351,669,100 | | Natural Resources, Agriculture, & Environmental Quality | $282,143,700 | $265,253,000 | $284,041,000 | $265,139,200 | $287,822,100 | | Public Education | $3,563,970,560 | $3,457,622,456 | $3,577,936,786 | $3,554,083,791 | $3,690,637,900 | | Retirement & Independent Entities | $36,164,100 | $35,019,800 | $36,177,700 | $45,355,400 | $41,880,600 | | Executive Appropriations | $73,694,600 | $64,394,400 | $60,948,200 | $77,318,100 | $95,891,200 | | Total | $11,663,195,210 | $11,460,172,306 | $11,611,807,936 | $11,817,422,541 | $12,583,571,500 |
|---|
| | | | | | Categories of Expenditure
(mouse-over category name for definition) | 2009
Actual | 2010
Actual | 2011
Actual | 2012
Actual | 2013
Approp |
|---|
| Personnel Services | $2,389,592,650 | $2,314,567,900 | $2,345,489,300 | $2,379,601,800 | $2,482,040,070 | | In-state Travel | $17,150,100 | $15,967,800 | $18,303,400 | $18,818,200 | $13,007,000 | | Out-of-state Travel | $5,739,600 | $4,727,600 | $4,793,300 | $6,085,100 | $5,403,500 | | Current Expense | $1,023,504,100 | $1,118,819,500 | $1,174,471,750 | $1,291,083,400 | $1,378,254,430 | | DP Current Expense | $165,245,500 | $142,160,900 | $149,128,100 | $153,223,200 | $144,945,300 | | DP Capital Outlay | $12,588,000 | $15,014,500 | $16,297,500 | $16,766,900 | $23,886,200 | | Capital Outlay | $1,135,267,400 | $958,643,000 | $596,153,800 | $656,405,000 | $666,092,200 | | Other Charges/Pass Thru | $6,758,240,160 | $6,720,526,406 | $7,138,684,586 | $7,085,991,891 | $7,637,048,300 | | Cost of Goods Sold | ($191,000) | $248,800 | ($285,000) | $70,400 | $0 | | Cost Accounts | ($1,900) | ($700) | $100 | $111,700 | $0 | | Transfers | $34,536,200 | $47,898,500 | $44,581,000 | $84,687,100 | $103,651,500 | | Trust & Agency Disbursements | $121,524,400 | $121,609,300 | $124,199,500 | $124,577,900 | $129,243,000 | | Total | $11,663,195,210 | $11,460,183,506 | $11,611,817,336 | $11,817,422,591 | $12,583,571,500 |
|---|
| | | | | | | Other Indicators | 2009
Actual | 2010
Actual | 2011
Actual | 2012
Actual | 2013
Approp |
|---|
| Budgeted FTE | 34,477.4 | 34,019.6 | 33,034.4 | 31,977.7 | 33,752.3 | | Vehicles | 7,291 | 7,120 | 7,084 | 7,095 | 7,132 |
|
|
|
|
|
|
|---|
Statewide Table of Contents
Table 3 - Expendable Funds and Accounts Sources of Finance
(click linked fund name for more info) | 2009
Actual | 2010
Actual | 2011
Actual | 2012
Actual | 2013
Approp | | General Fund | $2,636,400 | $2,281,900 | $2,242,900 | $2,242,900 | $2,242,900 | | General Fund, One-time | $550,000 | $13,800 | $0 | $11,273,000 | $100,000 | | General Fund Restricted | $6,855,700 | $5,216,900 | $3,837,900 | $26,864,800 | $7,500,000 | | Federal Funds | $5,603,700 | $10,780,900 | $4,969,900 | $8,515,200 | $5,825,000 | | Dedicated Credits | $25,746,800 | $46,520,600 | $18,459,000 | $63,738,000 | $6,221,900 | | Federal Mineral Lease | $78,050,100 | $56,924,500 | $61,973,600 | $67,177,900 | $66,300,000 | | Transfers | $0 | $0 | $0 | ($305,200) | $0 | | Beginning Balance | $515,220,100 | $565,783,100 | $578,610,800 | $600,406,000 | $1,231,200 | | Closing Balance | ($565,783,100) | ($578,610,800) | ($600,406,000) | ($663,537,900) | ($1,425,700) | | Total | $68,879,700 | $108,910,900 | $69,688,100 | $116,374,700 | $87,995,300 |
|---|
| | | | | | Committees
(click linked committee name to drill-down) | 2009
Actual | 2010
Actual | 2011
Actual | 2012
Actual | 2013
Approp |
|---|
| Executive Offices & Criminal Justice | $11,729,100 | $9,679,300 | $9,884,500 | $10,401,800 | $0 | | Business, Economic Development, & Labor | $10,493,200 | $10,703,400 | $8,568,400 | $11,130,500 | $4,777,400 | | Social Services | $42,731,000 | $86,794,900 | $50,378,800 | $94,266,800 | $82,817,900 | | Natural Resources, Agriculture, & Environmental Quality | $3,926,400 | $1,733,300 | $856,400 | $575,600 | $400,000 | | Total | $68,879,700 | $108,910,900 | $69,688,100 | $116,374,700 | $87,995,300 |
|---|
| | | | | | Categories of Expenditure
(mouse-over category name for definition) | 2009
Actual | 2010
Actual | 2011
Actual | 2012
Actual | 2013
Approp |
|---|
| Personnel Services | $24,600 | $37,200 | $27,700 | $40,000 | $0 | | In-state Travel | $0 | $0 | $0 | $200 | $0 | | Current Expense | $1,476,100 | $1,855,300 | $1,074,200 | $859,700 | $0 | | DP Current Expense | $600 | $1,000 | $600 | $1,000 | $0 | | Other Charges/Pass Thru | $20,008,000 | $15,401,900 | $14,726,700 | $17,387,600 | $4,777,400 | | Cost Accounts | $4,200 | $6,100 | $4,200 | $7,000 | $0 | | Transfers | $47,366,200 | $91,609,400 | $53,854,700 | $98,079,200 | $83,217,900 | | Total | $68,879,700 | $108,910,900 | $69,688,100 | $116,374,700 | $87,995,300 |
|---|
Statewide Table of Contents
Table 4 - Business-like Activities Sources of Finance
(click linked fund name for more info) | 2009
Actual | 2010
Actual | 2011
Actual | 2012
Actual | 2013
Approp | | General Fund, One-time | $539,100 | $0 | $0 | $0 | $0 | | General Fund Restricted | $0 | $0 | $0 | $800,000 | $0 | | Federal Funds | $94,217,800 | $379,554,100 | $184,699,400 | $109,854,300 | $19,159,000 | | Federal Funds - ARRA | $35,013,300 | $87,824,300 | $156,296,400 | $86,890,300 | $5,000,000 | | Dedicated Credits | $511,656,143 | $503,205,700 | $650,513,600 | $717,068,800 | $320,120,620 | | Internal Service Funds | $8,480,500 | $7,141,900 | $7,108,500 | $6,925,100 | $7,208,500 | | Enterprise Funds | $4,113,900 | $4,113,900 | $4,191,300 | $4,189,200 | $470,831,400 | | Transfers | $0 | $0 | $96,400 | $0 | $0 | | Other Financing Sources | $7,199,900 | $7,175,000 | $7,175,000 | $7,175,000 | $7,175,000 | | Beginning Balance | $894,795,200 | $683,389,200 | $426,365,900 | $403,779,700 | $0 | | Closing Balance | ($683,389,200) | ($426,365,900) | ($403,779,700) | ($530,301,600) | $0 | | Lapsing Balance | ($500) | ($100) | ($16,900) | ($814,500) | $0 | | Total | $872,626,143 | $1,246,038,100 | $1,032,649,900 | $805,566,300 | $829,494,520 |
|---|
| | | | | | Committees
(click linked committee name to drill-down) | 2009
Actual | 2010
Actual | 2011
Actual | 2012
Actual | 2013
Approp |
|---|
| Executive Offices & Criminal Justice | $23,766,200 | $19,598,000 | $20,426,100 | $21,098,400 | $21,769,600 | | Infrastructure & General Government | $283,101,800 | $263,350,000 | $279,902,600 | $257,146,800 | $269,361,300 | | Social Services | $491,545,243 | $873,049,800 | $643,156,200 | $444,848,800 | $471,635,800 | | Natural Resources, Agriculture, & Environmental Quality | $61,422,500 | $78,393,600 | $78,910,600 | $71,991,000 | $55,233,620 | | Retirement & Independent Entities | $12,790,400 | $11,646,700 | $10,254,400 | $10,481,300 | $11,494,200 | | Total | $872,626,143 | $1,246,038,100 | $1,032,649,900 | $805,566,300 | $829,494,520 |
|---|
| | | | | | Categories of Expenditure
(mouse-over category name for definition) | 2009
Actual | 2010
Actual | 2011
Actual | 2012
Actual | 2013
Approp |
|---|
| Personnel Services | $115,553,110 | $108,566,600 | $106,887,900 | $104,432,900 | $110,626,700 | | In-state Travel | $161,500 | $197,600 | $135,400 | $145,700 | $158,200 | | Out-of-state Travel | $138,900 | $23,100 | $123,200 | $89,400 | $194,200 | | Current Expense | $143,573,732 | $137,383,900 | $142,790,500 | $158,112,100 | $155,528,400 | | DP Current Expense | $36,559,116 | $28,352,800 | $28,198,700 | $13,653,600 | $17,799,900 | | DP Capital Outlay | $2,611,700 | $0 | $6,645,300 | $0 | $0 | | Capital Outlay | $734,900 | $182,400 | $173,500 | $9,400 | $414,900 | | Other Charges/Pass Thru | $551,473,100 | $949,498,300 | $721,058,200 | $509,136,800 | $526,829,920 | | Cost of Goods Sold | $2,030,900 | $424,400 | $300,600 | $121,200 | $304,300 | | Depreciation | $16,557,600 | $17,679,100 | $16,692,200 | $17,892,900 | $17,807,200 | | Transfers | $6,417,700 | $223,900 | $1,413,500 | $9,871,400 | $0 | | Trust & Agency Disbursements | $864,500 | $1,475,000 | $293,700 | $557,400 | $0 | | Total | $876,676,758 | $1,244,007,100 | $1,024,712,700 | $814,022,800 | $829,663,720 |
|---|
| | | | | | | Other Indicators | 2009
Actual | 2010
Actual | 2011
Actual | 2012
Actual | 2013
Approp |
|---|
| Budgeted FTE | 1,473.1 | 1,427.9 | 1,350.8 | 1,371.6 | 1,369.4 | | Vehicles | 194 | 200 | 183 | 203 | 202 |
|
|
|
|
|
|
|---|
Statewide Table of Contents
Table 5 - Restricted Fund and Account Transfers Sources of Finance
(click linked fund name for more info) | 2009
Actual | 2010
Actual | 2011
Actual | 2012
Actual | 2013
Approp | | General Fund | $21,213,500 | $4,825,400 | $4,888,600 | $2,682,300 | $4,432,300 | | General Fund, One-time | $58,642,900 | $14,451,700 | $6,980,000 | $9,000,000 | $21,588,400 | | Education Fund, One-time | $0 | $0 | $0 | $0 | $5,500,000 | | Uniform School Fund, One-time | $100,000,000 | $0 | $0 | $0 | $0 | | General Fund Restricted | $1,237,368 | $1,306,700 | $2,185,100 | $2,049,600 | $3,022,200 | | Capital Project Funds | $5,000,000 | $63,000,000 | $0 | $0 | $0 | | Enterprise Funds | $0 | $0 | $2,000,000 | $0 | $0 | | Other Financing Sources | $0 | $10,000,000 | $0 | $0 | $0 | | Beginning Balance | $4,803,300 | $3,938,900 | $5,051,100 | $0 | $0 | | Closing Balance | ($3,938,800) | ($5,051,100) | $0 | $0 | $0 | | Total | $186,958,268 | $92,471,600 | $21,104,800 | $13,731,900 | $34,542,900 |
|---|
| | | | | | Committees
(click linked committee name to drill-down) | 2009
Actual | 2010
Actual | 2011
Actual | 2012
Actual | 2013
Approp |
|---|
| Executive Offices & Criminal Justice | $247,400 | $218,300 | $216,000 | $2,216,000 | $4,216,000 | | Infrastructure & General Government | $55,000,000 | $73,251,200 | $0 | $0 | $11,000,000 | | Business, Economic Development, & Labor | $14,844,500 | $8,649,100 | $14,762,400 | $7,555,000 | $9,555,000 | | Social Services | $1,755,000 | $700,000 | $595,000 | $565,000 | $1,815,000 | | Natural Resources, Agriculture, & Environmental Quality | $15,111,368 | $9,653,000 | $5,531,400 | $3,395,900 | $7,956,900 | | Public Education | $100,000,000 | $0 | $0 | $0 | $0 | | Total | $186,958,268 | $92,471,600 | $21,104,800 | $13,731,900 | $34,542,900 |
|---|
| | | | | | Categories of Expenditure
(mouse-over category name for definition) | 2009
Actual | 2010
Actual | 2011
Actual | 2012
Actual | 2013
Approp |
|---|
| Transfers | $186,958,268 | $92,471,600 | $21,104,800 | $13,731,900 | $34,542,900 | | Total | $186,958,268 | $92,471,600 | $21,104,800 | $13,731,900 | $34,542,900 |
|---|
Statewide Table of Contents
Table 6 - Transfers to Unrestricted Funds Sources of Finance
(click linked fund name for more info) | 2009
Actual | 2010
Actual | 2011
Actual | 2012
Actual | 2013
Approp | | General Fund Restricted | $93,487,100 | $110,195,800 | $13,517,500 | $851,500 | $207,000 | | Education Special Revenue | $7,630,000 | $228,290,800 | $0 | $0 | $0 | | Transportation Special Revenue | $9,560,200 | $2,600,000 | $0 | $0 | $0 | | Dedicated Credits | $0 | $40,000 | $209,000 | $209,000 | $0 | | Special Revenue | $750,000 | $1,800,000 | $400,000 | $0 | $0 | | Capital Project Funds | $132,000,000 | $1,663,400 | $0 | $5,000,000 | $0 | | Internal Service Funds | $7,500,000 | $0 | $280,000 | $2,000,000 | $305,000 | | Enterprise Funds | $31,136,400 | $2,500,000 | $653,200 | $2,481,400 | $0 | | Beginning Balance | $56,800,000 | $0 | $27,093,800 | $19,252,400 | $60,752,400 | | Closing Balance | $27,321,700 | $0 | $0 | $0 | $0 | | Total | $366,185,400 | $347,090,000 | $42,153,500 | $29,794,300 | $61,264,400 |
|---|
| | | | | | Committees
(click linked committee name to drill-down) | 2009
Actual | 2010
Actual | 2011
Actual | 2012
Actual | 2013
Approp |
|---|
| Executive Offices & Criminal Justice | $9,560,200 | $6,600,000 | $0 | $4,000,000 | $0 | | Infrastructure & General Government | $255,131,400 | $328,178,500 | $22,620,000 | $22,252,400 | $15,557,400 | | Business, Economic Development, & Labor | $1,786,500 | $8,428,400 | $1,535,400 | $2,606,700 | $0 | | Social Services | $12,299,200 | $1,383,100 | $3,791,100 | $728,200 | $0 | | Natural Resources, Agriculture, & Environmental Quality | $3,286,400 | $2,500,000 | $507,000 | $207,000 | $207,000 | | Public Education | $84,121,700 | $0 | $13,700,000 | $0 | $45,500,000 | | Total | $366,185,400 | $347,090,000 | $42,153,500 | $29,794,300 | $61,264,400 |
|---|
| | | | | | Categories of Expenditure
(mouse-over category name for definition) | 2009
Actual | 2010
Actual | 2011
Actual | 2012
Actual | 2013
Approp |
|---|
| Transfers | $366,185,400 | $347,090,000 | $42,153,500 | $29,794,300 | $61,264,400 | | Total | $366,185,400 | $347,090,000 | $42,153,500 | $29,794,300 | $61,264,400 |
|---|
Statewide Table of Contents
Table 7 - Fiduciary Funds Sources of Finance
(click linked fund name for more info) | 2009
Actual | 2010
Actual | 2011
Actual | 2012
Actual | 2013
Approp | | Dedicated Credits | $48,082,100 | $13,840,000 | $16,729,000 | $15,927,800 | $24,926,000 | | Transfers | $3,004,200 | $3,115,000 | $173,900 | $0 | $0 | | Other Financing Sources | ($32,982,600) | $11,673,700 | ($9,626,600) | $12,812,900 | $0 | | Beginning Balance | ($34,117,000) | ($39,625,000) | ($46,815,000) | ($64,545,600) | $0 | | Closing Balance | $39,625,000 | $46,815,000 | $64,545,600 | $59,653,700 | $0 | | Total | $23,611,700 | $35,818,700 | $25,006,900 | $23,848,800 | $24,926,000 |
|---|
| | | | | | Committees
(click linked committee name to drill-down) | 2009
Actual | 2010
Actual | 2011
Actual | 2012
Actual | 2013
Approp |
|---|
| Business, Economic Development, & Labor | $23,611,700 | $35,818,700 | $25,006,900 | $23,848,800 | $24,926,000 | | Total | $23,611,700 | $35,818,700 | $25,006,900 | $23,848,800 | $24,926,000 |
|---|
| | | | | | Categories of Expenditure
(mouse-over category name for definition) | 2009
Actual | 2010
Actual | 2011
Actual | 2012
Actual | 2013
Approp |
|---|
| In-state Travel | $900 | $0 | $3,800 | $300 | $0 | | Current Expense | $495,700 | $737,000 | $705,300 | $765,100 | $0 | | DP Current Expense | $0 | $400 | $200 | $3,400 | $0 | | Other Charges/Pass Thru | $21,547,000 | $33,512,800 | $24,230,600 | $23,006,400 | $24,926,000 | | Transfers | $1,568,100 | $1,568,500 | $67,000 | $73,600 | $0 | | Total | $23,611,700 | $35,818,700 | $25,006,900 | $23,848,800 | $24,926,000 |
|---|
Statewide Table of Contents
Table 8 - Capital Project Funds Sources of Finance
(click linked fund name for more info) | 2009
Actual | 2010
Actual | 2011
Actual | 2012
Actual | 2013
Approp | | Transportation Fund | $70,977,000 | $70,977,000 | $72,396,500 | $76,633,600 | $0 | | Dedicated Credits | $2,884,400 | $4,314,300 | $3,355,500 | $5,976,000 | $0 | | Capital Project Funds | $213,489,900 | $169,760,700 | $52,376,700 | $189,226,200 | $0 | | Transfers | ($27,542,000) | $6,000,000 | $6,000,000 | $71,000,000 | $0 | | Other Financing Sources | $120,915,400 | $142,549,800 | $146,620,800 | $148,294,700 | $0 | | Beginning Balance | $194,040,800 | $141,767,700 | $254,733,200 | $296,727,800 | $0 | | Closing Balance | ($141,767,700) | ($254,733,200) | ($296,727,800) | ($457,157,500) | $0 | | Total | $432,997,800 | $280,636,300 | $238,754,900 | $330,700,800 | $0 |
|---|
| | | | | | Committees
(click linked committee name to drill-down) | 2009
Actual | 2010
Actual | 2011
Actual | 2012
Actual | 2013
Approp |
|---|
| Infrastructure & General Government | $432,997,800 | $280,636,300 | $238,754,900 | $330,700,800 | $0 | | Total | $432,997,800 | $280,636,300 | $238,754,900 | $330,700,800 | $0 |
|---|
| | | | | | Categories of Expenditure
(mouse-over category name for definition) | 2009
Actual | 2010
Actual | 2011
Actual | 2012
Actual | 2013
Approp |
|---|
| Transfers | $432,997,800 | $280,636,300 | $238,754,900 | $330,700,800 | $0 | | Total | $432,997,800 | $280,636,300 | $238,754,900 | $330,700,800 | $0 |
|---|
Statewide Table of Contents
Table 9 - Reconciled Transfers Included in Operating and Capital Budgets Sources of Finance
(click linked fund name for more info) | 2009
Actual | 2010
Actual | 2011
Actual | 2012
Actual | 2013
Approp | | Transfers - HED | $20,044,800 | $9,526,400 | $7,259,100 | $7,852,100 | $7,235,200 | | Transfers - Medicaid | $217,546,700 | $214,040,700 | $174,672,443 | $171,744,600 | $180,784,600 | | Transfers - Medicaid - DHS | $69,362,200 | $74,172,500 | $73,643,000 | $78,332,700 | $84,766,500 | | Transfers - Medicaid - DWS | $26,745,300 | $27,274,700 | $20,678,100 | $18,557,500 | $18,082,800 | | Transfers - Medicaid - JJS | $0 | $0 | $0 | $39,900 | $0 | | Transfers - Medicaid - GOPB | $0 | $0 | $0 | $857,800 | $994,900 | | Transfers - Medicaid - Internal DOH | $0 | $0 | $4,963,500 | $1,828,700 | $4,655,700 | | Transfers - Medicaid - UDC | $0 | $0 | $0 | $0 | $625,000 | | Transfers - Medicaid - USDB | $0 | $0 | $566,100 | $334,200 | $310,000 | | Transfers - Medicaid Admin | $0 | $0 | $0 | ($18,900) | $0 | | Total | $333,699,000 | $325,014,300 | $281,782,243 | $279,528,600 | $297,454,700 |
|---|
| | | | | | Agencies
(click linked agency name to drill-down) | 2009
Actual | 2010
Actual | 2011
Actual | 2012
Actual | 2013
Approp |
|---|
| Governor's Office | $0 | $0 | $0 | $1,179,800 | $1,962,800 | | Juvenile Justice Services | $14,119,200 | $13,134,800 | ($800,200) | ($1,559,800) | ($1,076,600) | | Health | $96,107,500 | $101,447,200 | $104,366,100 | $105,374,200 | $114,779,100 | | Workforce Services | $30,946,800 | $27,139,900 | $23,048,300 | $20,983,700 | $24,648,000 | | Human Services | $171,974,800 | $173,039,500 | $146,665,200 | $145,011,100 | $148,841,200 | | University of Utah | $3,976,300 | $3,625,100 | $3,699,800 | $3,699,800 | $3,699,800 | | Utah State University | $8,533,800 | $1,315,200 | $832,200 | $943,500 | $832,200 | | Weber State University | $116,400 | $1,022,000 | $562,200 | $367,400 | $562,200 | | Southern Utah University | $243,600 | $257,900 | $157,600 | $220,200 | $157,600 | | Utah Valley University | $1,020,500 | $1,110,800 | $822,900 | $1,081,500 | $822,900 | | Snow College | $230,500 | $69,000 | $143,400 | $143,400 | $143,400 | | Dixie State College | $430,200 | $468,900 | $451,600 | $541,000 | $451,600 | | Salt Lake Community College | $1,467,400 | $759,800 | $565,500 | $709,200 | $565,500 | | State Board of Regents | $4,026,100 | $897,700 | $23,900 | $146,100 | $0 | | State Board of Education | $505,900 | $726,500 | $1,243,743 | $687,500 | $1,065,000 | | Total | $333,699,000 | $325,014,300 | $281,782,243 | $279,528,600 | $297,454,700 |
|---|
Statewide Table of Contents
Table 10 - Operating and Capital Budget Including Expendable Funds and Eliminating Reconciled Internal Transfers Sources of Finance
(click linked fund name for more info) | 2009
Actual | 2010
Actual | 2011
Actual | 2012
Actual | 2013
Approp | | General Fund | $1,960,708,550 | $1,832,844,050 | $2,000,669,450 | $1,992,063,550 | $2,063,302,100 | | General Fund, One-time | $158,972,600 | ($20,056,200) | $57,709,100 | $106,939,000 | $58,897,400 | | Education Fund | $384,367,200 | $350,937,400 | $2,675,594,686 | $2,710,794,991 | $2,896,688,300 | | Education Fund, One-time | ($74,259,100) | ($80,684,300) | ($70,371,000) | $4,696,600 | $43,075,000 | | Uniform School Fund | $2,332,619,286 | $2,178,256,186 | $19,000,000 | $19,000,000 | $16,000,000 | | Uniform School Fund, One-time | $76,204,600 | $181,836,700 | $30,000,000 | $12,000,000 | $45,000,000 | | Transportation Fund | $443,315,400 | $492,114,000 | $376,826,300 | $403,765,400 | $446,900,000 | | General Fund Restricted | $280,922,500 | $278,360,500 | $270,060,100 | $307,953,800 | $314,859,100 | | Education Special Revenue | $28,375,100 | $26,215,000 | $25,192,800 | $28,425,400 | $25,325,300 | | Transportation Special Revenue | $50,865,400 | $56,890,700 | $60,338,600 | $60,852,100 | $61,011,900 | | Federal Funds | $2,888,211,300 | $3,224,999,700 | $3,423,855,100 | $3,554,534,600 | $3,462,032,700 | | Federal Funds - ARRA | $315,719,400 | $441,610,600 | $241,293,800 | $45,068,300 | $86,979,200 | | Dedicated Credits | $913,661,400 | $1,004,941,900 | $1,087,847,300 | $1,189,558,000 | $1,056,105,100 | | Land Grant | $1,303,100 | $1,386,400 | $1,297,400 | $1,666,100 | $1,110,100 | | Federal Mineral Lease | $165,533,700 | $123,028,300 | $132,577,300 | $145,760,300 | $154,079,400 | | Special Revenue | $5,283,200 | $4,291,300 | $36,557,000 | $58,622,900 | $46,010,300 | | Private Purpose Trust Funds | $4,362,200 | $4,278,400 | $2,796,100 | $2,787,700 | $2,837,800 | | Capital Project Funds | $620,985,200 | $411,030,800 | $358,877,200 | $329,927,600 | $755,134,800 | | Internal Service Funds | $119,900 | $0 | $0 | $0 | $0 | | Enterprise Funds | $111,721,300 | $105,386,000 | $106,047,700 | $147,836,500 | $138,977,500 | | Transfers | $118,379,600 | $104,319,800 | $24,544,657 | $39,078,700 | $60,845,400 | | Other Financing Sources | $619,647,074 | $630,438,570 | $662,986,600 | $654,365,500 | $631,117,100 | | Pass-through | $6,937,800 | $4,434,300 | $5,164,100 | $3,791,600 | $2,992,600 | | Beginning Balance | $816,790,500 | $832,452,600 | $856,778,900 | $947,101,300 | $113,363,400 | | Closing Balance | ($798,417,300) | ($881,452,400) | ($936,801,300) | ($1,069,245,300) | ($105,871,900) | | Lapsing Balance | ($33,954,000) | ($63,791,400) | ($49,128,100) | ($43,076,000) | ($2,660,500) | | Total | $11,398,375,910 | $11,244,068,906 | $11,399,713,793 | $11,654,268,641 | $12,374,112,100 |
|---|
| | | | | | Committees
(click linked committee name to drill-down) | 2009
Actual | 2010
Actual | 2011
Actual | 2012
Actual | 2013
Approp |
|---|
| Executive Offices & Criminal Justice | $727,614,050 | $703,168,050 | $725,296,150 | $739,013,250 | $774,952,200 | | Infrastructure & General Government | $2,026,651,500 | $1,771,190,900 | $1,612,851,700 | $1,640,966,100 | $1,842,895,200 | | Business, Economic Development, & Labor | $286,937,000 | $277,814,700 | $286,650,500 | $316,770,400 | $384,049,200 | | Social Services | $3,148,388,600 | $3,413,522,600 | $3,502,260,100 | $3,660,665,500 | $3,912,214,800 | | Higher Education | $1,249,391,300 | $1,255,076,200 | $1,313,939,000 | $1,355,068,800 | $1,344,433,900 | | Natural Resources, Agriculture, & Environmental Quality | $286,070,100 | $266,986,300 | $284,897,400 | $265,714,800 | $288,222,100 | | Public Education | $3,563,464,660 | $3,456,895,956 | $3,576,693,043 | $3,553,396,291 | $3,689,572,900 | | Retirement & Independent Entities | $36,164,100 | $35,019,800 | $36,177,700 | $45,355,400 | $41,880,600 | | Executive Appropriations | $73,694,600 | $64,394,400 | $60,948,200 | $77,318,100 | $95,891,200 | | Total | $11,398,375,910 | $11,244,068,906 | $11,399,713,793 | $11,654,268,641 | $12,374,112,100 |
|---|
Statewide Table of Contents |