Compendium of Budget Information for the 2013 General Session
| Business, Economic Development, & Labor Appropriations Subcommittee | |||||||||||||||||||||||||||||||||||||||||||||||||||||||||||||||||||||||||||||||||||||||||||||||||||||||||||||||||||||||||||||||||||||||||||||||||||||||||||||||||||||||||||||||||||||||||||||||||||||||||||||||||||||||||||||||||||||||||||||||||||||||||||||||||||||||||||||||||||||||||||||||||||||||||||||||||||||||||||||||||||||||||||||||||||||||||||||||||||||||||||||||||||||||||||||||||||||||||||||||||||||||||||||||||||||||||||||||||||||||||||||||||||||||||||||||||||||||||||||||||||||||||||||||||||||||||||||||||||||||||||||||||||||||||||||||||||||||||||||||||||||||||||||||||||||||||||||||||||||||||||||||||||||||||||||||||||||||||||||||||||||||||||||||||||||||||||||||||||||||||||||||||||||||||||||||||||||||||||||||||||||||||||||||||||||||||||||||||||||||||||||||||||||||||||||||||||||||||||||||||||||||||||||||||||||||||||||||||||||||||||||||||||||||||||||||||||||||||||||||||||||||||||||||||||||||||||||||||||||||||||||||||||||||||||||||||||||||||||||||||||||||||||||||||||||||||||||||||||||||
| <-Previous Page | Subcommittee Table of Contents | Next Page-> | |||||||||||||||||||||||||||||||||||||||||||||||||||||||||||||||||||||||||||||||||||||||||||||||||||||||||||||||||||||||||||||||||||||||||||||||||||||||||||||||||||||||||||||||||||||||||||||||||||||||||||||||||||||||||||||||||||||||||||||||||||||||||||||||||||||||||||||||||||||||||||||||||||||||||||||||||||||||||||||||||||||||||||||||||||||||||||||||||||||||||||||||||||||||||||||||||||||||||||||||||||||||||||||||||||||||||||||||||||||||||||||||||||||||||||||||||||||||||||||||||||||||||||||||||||||||||||||||||||||||||||||||||||||||||||||||||||||||||||||||||||||||||||||||||||||||||||||||||||||||||||||||||||||||||||||||||||||||||||||||||||||||||||||||||||||||||||||||||||||||||||||||||||||||||||||||||||||||||||||||||||||||||||||||||||||||||||||||||||||||||||||||||||||||||||||||||||||||||||||||||||||||||||||||||||||||||||||||||||||||||||||||||||||||||||||||||||||||||||||||||||||||||||||||||||||||||||||||||||||||||||||||||||||||||||||||||||||||||||||||||||||||||||||||||||||||||||||||||||||||
Background The Tax Administration line item includes 10 program areas: Tax Administration, Auditing Division, Multi-State Tax Compact, Technology Management (DTS), Processing Division, Seasonal Employees, Tax Payer Services, Property Tax, Motor Vehicles, and the Motor Vehicle Enforcement Division. Intent Language
Funding Detail For more detail about a particular source of finance or organizational unit, click a linked entry in the left column of the table(s) below.
Program: Administration Division Function The Administration Division includes the Commissioners' and the Executive Director's Offices. Both offices provide direction and management to the department. The Commissioners' Office:
The Executive Director's section:
Performance The three top measures the Administration division cites as evidence of its success are, 1) successful oversight of the tax system implementation process, 2) number of tax appeal cases closed by fiscal year, and 3) timely distribution of revenue. The Tax Commission has been directing nonlapsing balances towards automating its processes since FY 2006. Successful oversight and implementation of the new computer systems has been a top priority of the Administration division since inception of the project, it cites 'the percentage of target completed each month' as an important indicator of success because the replacement of computer systems is key to the agency's improvement and efficiency efforts and fulfilling its mission. In FY 2013, the focus for this project is in the Motor Vehicle and Motor Vehicle Enforcement divisions. The Administration division reports 100% of the target completed each month since FY 2008. Taxpayers have a right to appeal to the Tax Commission their state tax assessments, and local property tax appeals that the county has denied. This measurement monitors appeals activity and the cases that are closed each year. Currently, for property tax appeals, an appeal for one year may not be concluded before the valuation notices are sent to the property owner for the following year. Since FY 2002, the cleared appeals have ranged from a low of 1,271 to a high of 3,819. In FY 2012, the division finalized 3,108 appeals. 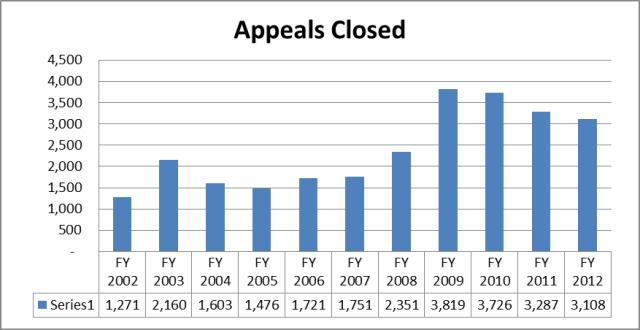 Timely distribution of revenue represents the role of the Tax Commission in collecting local sales taxes and distributing those taxes to the proper municipalities or counties. Local entities rely on their sales tax collections for operating cash flow and the funding their programs. This goal helps ensure that most of the funds collected each month is ready for transfer to those entities by the distribution deadlines. The Tax Commission has set a goal of achieving a timely distribution for 95% of the largest taxpayers. The graph below shows actual percentages from FY 2008 through FY 2012. 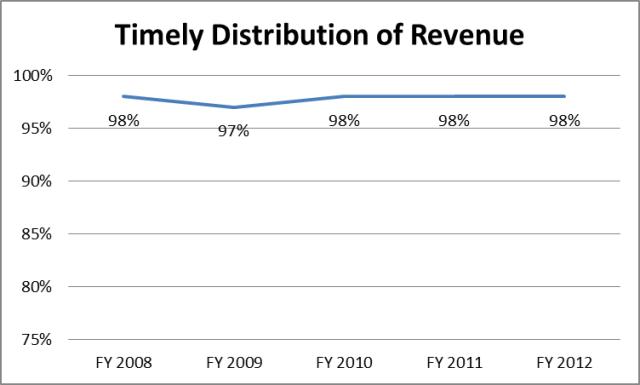 Funding Detail The Administration Division is funded primarily from General Fund and Education Fund. It also has the nonlapsing funds related to the long-term project of modernizing the agency's tax and motor vehicle systems.
Function The Auditing Division attempts to increase voluntary and involuntary taxpayer compliance through selective examination of taxpayer returns and supporting records. The division audits all taxes except property tax (local level), and conducts audits in-house and at taxpayers' places of business. The division emphasizes compliance audits for accurate tax return reporting, and review for possible investigation of suspected fraud and tax evasion. Through educational outreach and customer service, the division works to help taxpayers report future taxes properly. Performance The coverage areas for the Auditing Division include about 1.2 million income tax returns and about another 0.8 million business returns. The division wants to ensure that those being audited believe they are treated fairly in the audit process. Surveys are provided at the end of every audit, allowing taxpayers to provide input to the quality of the audit process. Input can be provided anonymously or taxpayers can identify themselves when providing feedback. The following chart details audit satisfaction on a scale from one to five. A rating of five indicates the taxpayer "strongly agrees" with the statement, "overall, I was satisfied with the manner in which the audit was conducted," and a rating of one means the taxpayer "strongly disagrees" with the statement. Over the past ten years, the division has consistently maintained a rating between four and five. 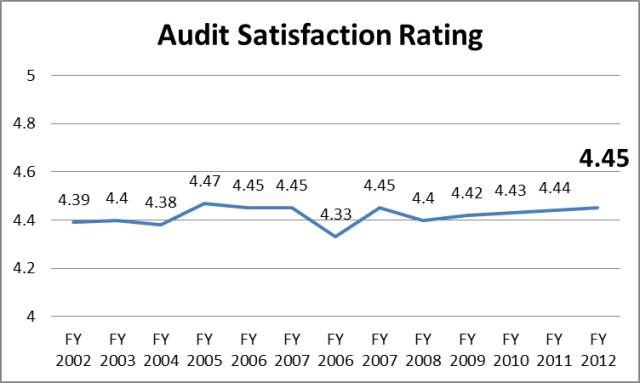 The Auditing Division also considers indicative of its success the number of new accounts discovered (sales and corporate) from auditing activities. Efforts are taken to identify taxpayers that are not in compliance with state filing requirements. This measurement shows the results of those activities from year to year. The chart that follows represents new accounts discovered from FY 2006 to FY 2012. 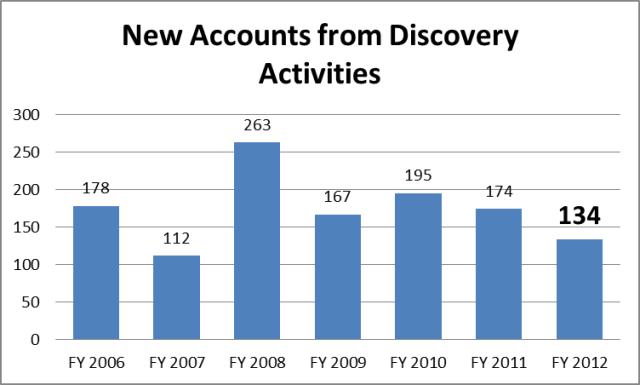 Another measurement of performance success is whether the number of income tax audits performed is increasing. The Auditing Division sets goals for each of their sections at the beginning of the year with the expectation that this goal will be met each year. The division internally monitors progress throughout the year to ensure that the audit targets are met. The table below represents indexes of the number of income tax audits performed and the hours spent on income tax. The number of individual income tax audits performed is up 13% over FY 2011 and the division has met its target number of income tax audits and hours performing income them consistently each year since FY 2008. 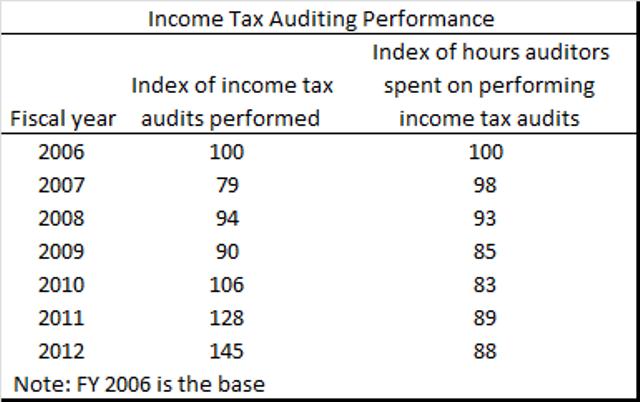 Funding Detail The Auditing Division is funded mostly from the General Fund, the Education Fund, and the Tax Commission Administrative Charge Restricted Account.
Program: Multi-State Tax Compact Function The Multi-State Tax Compact (MTC) is a group of state governments working together to help make state tax systems fair, effective, and efficient for interstate and international commerce. It is also an effort to protect state tax sovereignty. The Compact's two primary projects are the Joint Audit Program and the National Nexus Program. The Joint Audit Program reviews a business' sales and corporate income tax filings for several states at the same time. Accordingly, the audit program encourages compliance with state tax laws, generates tax revenues for states, contributes to uniformity in taxpayer treatment, and helps states learn about new industry conditions and circumstances. The National Nexus Program encourages voluntary disclosure and discovers businesses that are not filing returns with states. The Nexus program facilitates an exchange of information between states to identify business reporting or filing inconsistencies among these states. The Tax Commission utilizes the work of the MTC in that assessments from MTC audits amounted to $1.4 million in FY 2008, $3.9 million in FY 2009, $2.5 million in FY 2010, and $2.4 million in FY 2011. Statutory Authority Although the State is not required to be a member of the MTC, in Utah Annotated Code Title 59, Chapter 1, Section 801 the Legislature enacted into law Utah's participation in this compact. Funding Detail Funding for the Multi-State Tax Compact is from the General Fund, the Education Fund, and the Tax Commission Administrative Charge Restricted Account. Annual expenditures represent membership dues to the Multi-State Tax Compact and multi-state audit services that are provided by that organization.
Program: Technology Management Function The Department of Technology Services (DTS) now operates and maintains the Tax Commission's automated systems. It also develops and installs new automated systems to meet specialized demands. In addition, DTS provides service to internal customers through a system-wide "help desk." Background The Tax Commission continues to modernize tax and motor vehicle systems and processes. New funding to replace the state's core tax systems was initiated in 2006 with a one-time appropriation of $7 million to DTS. During the 2007 General Session, project funding included $5 million as part of the total payment towards replacing the existing system, and during the 2008 General Session another $6 million was appropriated for the project. The total vendor cost to replace the existing core systems was $22.5 million, with $4.5 million of this stemming from savings from other areas of the Tax Commission's appropriations. This project has included the replacement of the automated systems used to process, record, and distribute sales tax, income tax, employer withholding tax, corporate tax, motor and special fuel taxes, and other miscellaneous taxes. Chronology of Implementation:
Other initiatives pursued by the Tax Commission include the expanded use of online filing, scanning or image-lifting technology to electronically extract return information, and designing systems so that "data warehousing" of taxpayer information can be accomplished. Strategic use of new technologies allows the agency to improve its processes and assists in providing quality customer service to taxpayers and vehicle owners. All of these improvements will provide better tools to assist taxpayers in tax compliance and make the processing and verification of taxpayer information more efficient. Improvements are expected to continue until all systems and processes have been updated. It should be noted that Technology Management employees are now classified as part of the Department of Technology Services workforce. Performance The Technology Management Division deals with systems that handle over 2 million electronically filed documents, as well as upkeep and management of the databases related to over 7 million tax returns, payments, and transactions each year. Performance measures for the Technology Management Division are presented within the DTS budget. Click here for the link to the DTS performance measures. Funding Detail The Technology Management Division is funded from 4 primary sources, the General Fund, Education Fund, Transportation Fund and the Tax Commission Administrative Charge Restricted Account. In FY 2011, 99% of the division expenses were categorized as Data Processing costs. These costs include charges from DTS for help desk support, computer security and wide area network connections (26%). It also includes the cost of DTS programmers who assist in development, maintenance and support of agency computer programs (46%). It also includes software licensing and maintenance costs paid to vendors (24%).
Program: Tax Processing Division Function The Tax Processing Division designs and produces both on-line and paper tax forms, instructions, and publications for taxpayer use. It collects and records tax payments and taxpayer information, processes paper and electronic tax documents, and maintains archival records. This division is using updated technologies provided by new systems to image documents. Copies of returns, payments, and correspondence can now be accessed in real time, as compared to the prior microfilm and manual retrieval process. Performance In terms of workload, the Processing Division deals with:
Indicative of the Processing Division's accountability are the dates by which all timely-filed income tax returns are entered and checks deposited. The goal is to record and deposit these funds as quickly as possible to keep account information current. Processing completion dates can vary from year to year based upon a number of factors, including the timing of when the majority of the workload is received. In FY 2012, the Processing Division processed returns ahead of the date by which the State would be required to pay interest on returns that are filed accurately and on time. The table below represents the date by which all timely filed returns were entered and checks deposited. 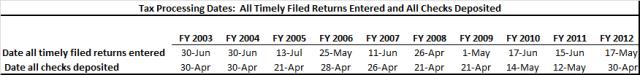 A measure of efficiency for the division is the percent of income tax refund requests processed within 15 working days. Once taxpayers file their returns, if they are due a refund, they would like it in a timely manner. This measurement shows how well the division did compared to the 15 working day target. 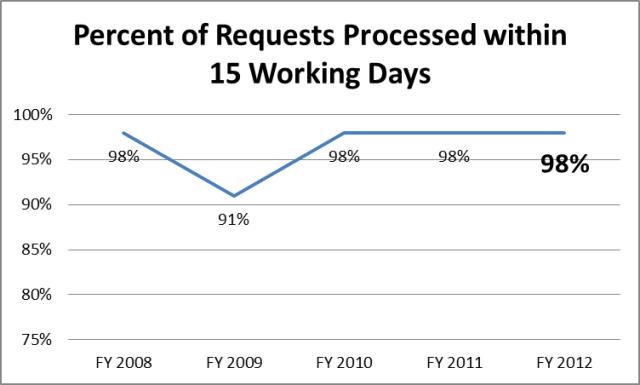 A measure the division recently began tracking is the percent of the business tax returns filed electronically. An on-line return application for all business taxes is now available using a Taxpayer Access Portal (TAP). Once taxpayers use the online applications, they tend to continue filing that way. This requires less resources to handle and enter paper returns. Increased efficiency and reduced costs are realized with a high percentage of electronic tax filings.
Funding Detail The Processing Division is funded by the General Fund, Education Fund, Transportation Fund, and the Tax Commission Administrative Charge Restricted Account. Personnel costs make up 76% of the division's expenditures. Current expenses account for 22% of the division's budget. The largest current expenses include postage, printing, credit card processing fees charged by vendors, building costs paid to DFCM, and processing equipment.
Function Seasonal employees are a factor in the efficient operation of the Tax Commission. Commission workloads vary sharply throughout the year. For instance, the Processing Division utilizes temporary employees during high volume document filing periods, such as the spring for income tax returns and each quarter for business tax returns. Funding Detail The seasonal budget is primarily comprised of General Fund and Education Fund. 100% of this budget goes to hiring temporary employees during the peak income tax processing period (around April 15th). On an average annual basis, the budgeted seasonal employee costs $22,195 in wages and $3,052 in benefits.
Function Through outreach and education programs, Taxpayer Services promotes voluntary compliance with Utah tax statutes. Its employees respond to written, phone, or in-person requests from taxpayers, assisting them in meeting their requirements and in resolving tax issues by providing timely and accurate information. The program also uses the Treasury Offset Program to garnish federal refunds of delinquent Utah taxpayers from the following year. The division also outsources debt collection of accounts that are not in litigation, under a payment agreement, assigned to a collector for active collection, or whose outsourcing would be in violation of state or federal law. Performance In terms of workload, the Taxpayer Services Division deals with:
The division strives to maintain low ratio of expenses to the delinquent dollars collected. This is monitored to ensure that this low expense to revenue ratio is maintained. 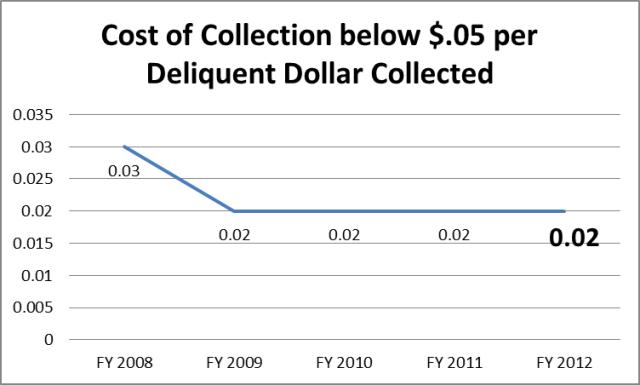 The divison also tracks the number of delinquent cases cleared to zero. This measurement keeps track of progress the division is making on working and clearing accounts with taxpayers that have outstanding, and overdue tax balances. Goals are set each year, with actual results being monitored each month. In FY 2012, the division cleared 97,304, a 5% increase from the previous fiscal year. 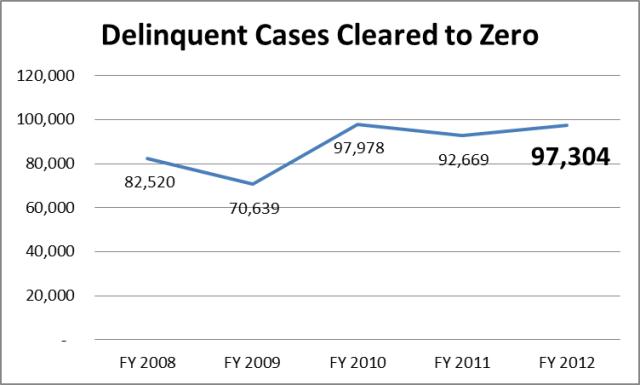 This measurement shows how many days on average it takes before a delinquent account is collected. The sooner accounts are worked, the more likely the account can be cleared up, so a lower number is desirable. While the division can influence this result, economic factors, resources and taxpayer ability to pay can all impact this ratio. 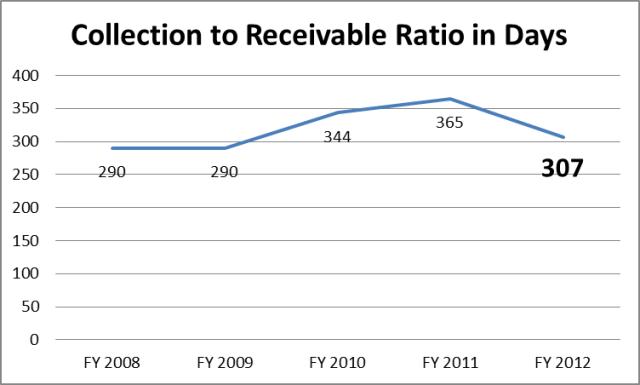 Funding Detail The Taxpayer Services Division is funded primarily with General Fund, Education Fund, and the Tax Commission Adminstrative Charge Restricted Account.
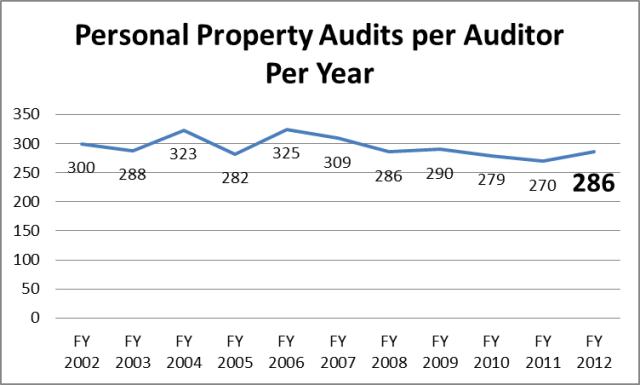
Program: Property Tax Division Function The Property Tax Division appraises and audits complex natural resource extraction and transportation related properties in the state, as well as properties that cross county or state lines. Such properties include those owned by airlines, motor carriers, railroads, and utilities. The division works with local officials to assure equitable and accurate assessment and taxation under local property tax systems. It also administers the Truth-In-Taxation law. Statutory Authority The Utah Constitution, Article XIII, Section 6, Paragraph 3 provides authority for the State Tax Commission to assess, adjust, and equalize property values and to revise local property tax levies when necessary. The Property Tax Division also draws authority from the Property Tax statute contained in Utah Annotated Code Title 59, Chapter 2. Performance The top three performance measures the Property Tax Division considers as indicative of its success are, 1) Timely Completion of Valuation of Centrally Assessed Companies, 2) the Percent of Counties NOT Received Correction Action Orders, and 3) Personal Property Audits per Auditor per Year. FY 2012 performance measures: Timely Completion of Valuation of Centrally Assessed Companies This measurement shows what percentage of the centrally assessed companies valuations were completed on time. The assessment must be completed on time so counties and local entities can establish their budgets. Since FY 2002, this has been consistent at 100%. Centrally Assessed Valuations:
Percent of Counties NOT Received Correction Action Orders All counties must be in compliance with statutory requirements, otherwise the Tax Commission must issue corrective action orders to bring them into compliance. Working closely with counties is ensuring that requirements are being met and with the exception of FY 2008 at 86 percent, the division has consistently achieved 100% for this measurement. Personal Property Audits per Auditor per Year The Personal Property Tax section performs audits for counties. This measurement is used to monitor the workload of that section's staff.
 Funding Detail 97 percent of the Property Tax Division's financing comes from the Education Fund. A portion of funding comes from a dedicated credit property assessment fee authorized by UCA 59-2-703 and 59-2-705.
Function The Division of Motor Vehicles (DMV) administers statewide vehicle title, registration, and related functions. It implements motor vehicle policy and procedure and helps maintain the State's motor vehicle computer system. Also, the DMV provides training to all customer service agents, manages a telephone section for statewide assistance, processes impound and revocation information, and manages vehicle-related appeals. Additionally, the DMV administers the International Registration Plan and the International Fuel Tax Administration Plan. Utah Code 59-2-406 authorizes the Tax Commission to contract with county governments, at the counties' option, to provide local customer services for the combined collection of the county's fee-in-lieu and Title 41 Motor Vehicle Fees. Several counties have elected to retain those functions. Fees for the reciprocal services provided between the State and counties are established in statute. Subsection 406 (3) sets the reimbursement fee and instructs that an adjustment be made each year based on the prior year�s consumer price index change. The approval of fees is made by the Legislature. Statutory Authority Utah Annotated Code Title 41 covers the State's motor vehicle laws. Title 41, Chapter 1a is the primary section adminstered by the Motor Vehicle Division, which includes registration requirements and motor vehicle fees. The Motor Vehicle Division also draws authority from Title 41, Chapter 22 to administer Off-Highway vehicle registration requirements, and Title 73, Chapter 18 to administer Boat Registration and Fee requirements. Performance In terms of work to be managed, the Motor Vehicle Division deals with:
The top three measures used by the Motor Vehicles division to assess performance are, 1) Average Wait Time to Maximum Wait Time, 2) Percent of Renewals Completed Online, and 3) successful development, testing, and implementation of new computer systems. Timely assistance in Motor Vehicle Offices is important to citizens, and average wait times are monitored on an ongoing basis. This gauge is used to monitor the trend in wait times and adjust staffing as necessary. 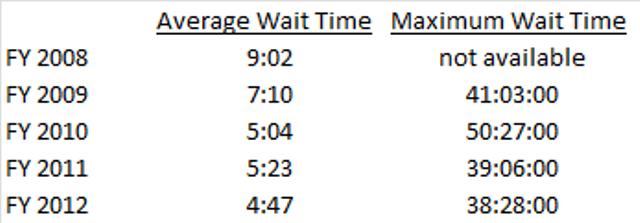 Online renewal options are continuously promoted , since those transactions require less staffing resources and reduced wait times in the offices for those that must come to the office. Additional office space and staffing has been avoided as a significant increase in the use of online renewal options has been realized. Although largely dependent upon the demand side, the division tracks internet renewals and considers the increasing use of internet and on-the-spot transactions as indicative of its effort to improve efficiency. The number of internet renewals has grown from 67,534 in FY 2001 to 572,221 in FY 2012 and the number of on-the-spot transactions has grown from 9,062 in FY 2001 to 538,208 in FY 2012. 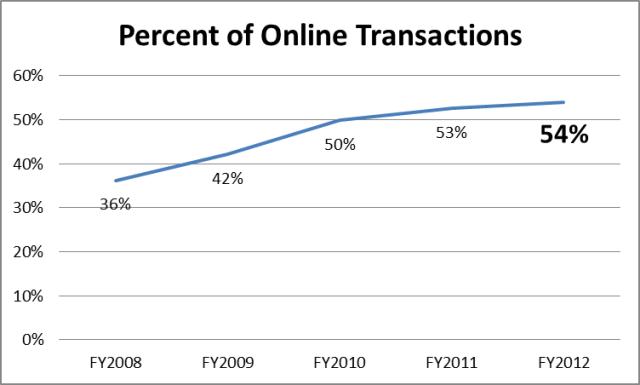 Motor Vehicles is currently one of two divisions phasing in new computer systems, which will continue through FY 2014. Successful development, testing and implementation of its computer systems is a third performance measure cited to gauge succes. Having the necessary work completed at every benchmark date is critical for the successful implementation of the system that is necessary for a successful motor vehicle function of the state. The division provided the following goals for this measurement:
Funding Detail 39 percent of the Motor Vehicle Division's funding comes from restricted revenues, followed by General Fund at 36 percent, Dedicated Credits at 25 percent, and the Transportation Fund at 11 percent. For FY 2012, personnel costs make up 54 percent of the division's expenditures, and 45 percent of the division's budget is current expenses. This includes expenses associated with merchant fees for accepting credit cards and online payments, postage costs associated with mailing renewal notices and sending out decals for online transactions, paying counties to perform motor vehicle services for county-run offices, and building lease costs for branch offices.
Program: Motor Vehicle Enforcement Division Function The Motor Vehicle Enforcement Division (MVED) protects Utah citizens from motor vehicle fraud and attempts to foster a healthy motor vehicle sales environment. Officer duties include title, odometer and motor vehicle dealer fraud investigations, regulatory licensing enforcement, VIN inspections, registration enforcement, and investigation of consumer complaints against licensed dealers, commercial auto theft, and salvage vehicle fraud. During FY 2011 the number of motor vehicle dealers and motor vehicle salesmen in the state reached 17,400. Statutory Authority Utah Annotated Code Title 41 covers the State's motor vehicle laws. Title 41, Chapter 3 is the primary section adminstered by the MVED. The Chapter specifies motor vehicle business regulations. Performance The division tracks the total number of motor vehicle crime investigations each year in order to assess the work load and output of investigative staff. The number of crime investigations in FY 2012 declined to 2,400 from 2,410 in FY 2011. This is below the ten year average of 2,552. 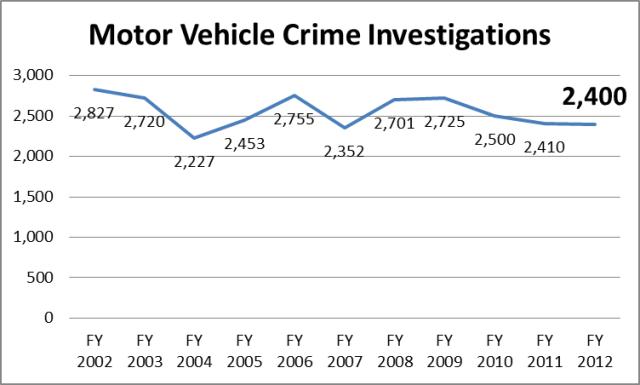 Each year, MVED officers recover more stolen vehicles than other law enforcement officers because of an emphasis on vehicle enforcement. The following graph shows the number of stolen vehicles recovered over time. In FY 2012, the number of recovered stolen vehicles was 367, a decrease of 14 percent when compared to FY 2011. 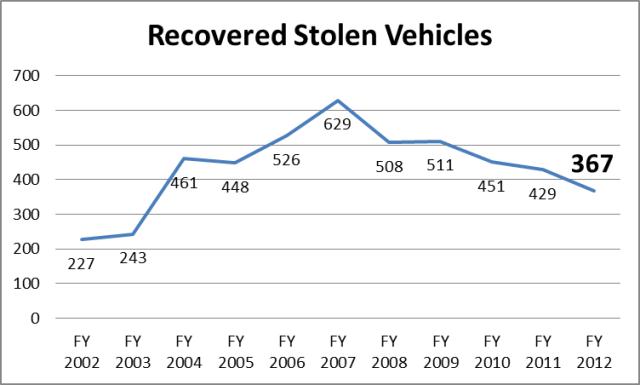 The Motor Vehicle Enforcement division is currently one of two divisions phasing in new computer systems, which will continue through FY 2014. Successful development, testing and implementation of its computer systems is a third performance measure cited to gauge succes. The division provided the following goals for this measurement:
Funding Detail The greatest portion of the Motor Vehicle Enforcement Division's (MVED) funding is in the form of dedicated credits. The temporary permit fee issued by vehicle dealers upon sale of a vehicle generates the greatest amount of revenue for MVED's dedicated credits. Senate Bill 106 of the 2007 General Session removed the temporary permit fee from statute. The Motor Vehicle Enforcement Division is now authorized to request modification of this fee in the budget process to cover division cost increases, as well as compensation package costs that must be paid from these fees. During the 2009 General Session, the Legislature authorized this fee to increase from $8 per transaction to $12. 80 percent of the division's budget is allocated to personnel services for the enforcement of the state's vehicle registration laws, fraud and theft detection, and the oversight functions assigned to the division related to the motor vehicle industry. Current expenses are 19 percent of the division�s budget, with vehicle and communication costs being the major areas of expense. Other large expense categories are dispatch services and vendor credit card processing costs.
| |||||||||||||||||||||||||||||||||||||||||||||||||||||||||||||||||||||||||||||||||||||||||||||||||||||||||||||||||||||||||||||||||||||||||||||||||||||||||||||||||||||||||||||||||||||||||||||||||||||||||||||||||||||||||||||||||||||||||||||||||||||||||||||||||||||||||||||||||||||||||||||||||||||||||||||||||||||||||||||||||||||||||||||||||||||||||||||||||||||||||||||||||||||||||||||||||||||||||||||||||||||||||||||||||||||||||||||||||||||||||||||||||||||||||||||||||||||||||||||||||||||||||||||||||||||||||||||||||||||||||||||||||||||||||||||||||||||||||||||||||||||||||||||||||||||||||||||||||||||||||||||||||||||||||||||||||||||||||||||||||||||||||||||||||||||||||||||||||||||||||||||||||||||||||||||||||||||||||||||||||||||||||||||||||||||||||||||||||||||||||||||||||||||||||||||||||||||||||||||||||||||||||||||||||||||||||||||||||||||||||||||||||||||||||||||||||||||||||||||||||||||||||||||||||||||||||||||||||||||||||||||||||||||||||||||||||||||||||||||||||||||||||||||||||||||||||||||||||||||||
| <-Previous Page | Next Page-> |
COBI contains unaudited data as presented to the Legislature by state agencies at the time of publication. For audited financial data see the State of Utah's Comprehensive Annual Financial Reports.