Agency: Human Resource Management Line Item: Human Resource Management Function The mission of DHRM is to provide tools and remove barriers so agencies can manage their human resources in order to accomplish their missions for the citizens of Utah.
Statutory Authority The powers and duties of DHRM are established in UCA 67-19-5. The director is given full responsibility and accountability for administration of statewide human resource management. Responsibilities for the department are identified in UCA 67-19-6, some of which include: - administer a statewide personnel management program that aids efficient execution of public policy, fosters careers, and assists state agencies in performing their missions;
- design and administer the state pay plan, classification system, and recruitment and selection system;
- ensure human resource practices comply with federal law, state law, and state rules;
- adopt rules for personnel management;
- maintain a management information system that will provide current information on authorized positions, payroll, and related matters;
- help eliminate discrimination in state employment;
- advise local governments on effective personnel management when requested;
- establish compensation policies and procedures for early voluntary retirement;
- conduct research and planning activities to prepare for future human resource needs, improve human resource management, and submit needed policy changes to the governor;
- establish statewide training programs.
UCA 67-19-5 allows DHRM to operate an internal service fund and UCA 67-19-6.1 allows the director to establish field offices at state executive branch agencies in consultation and agreement with the agency head. Intent Language
Under terms of Section 63J-1-603-(3)(a) Utah Code Annotated the Legislature intends that appropriations provided for Human Resource Management in item 2 of Chapter 10 Laws of Utah 2011 not lapse at the close of Fiscal Year 2012. The use of any non-lapsing funds is limited to the following: Information Technology and Consulting Services - $350,000; and DHRM Statewide Management of Liability Training Program - $260,000.
Senate Bill 3, 2012 General Session - Item 119
Performance An important component of the overall state human resource management is the ratio of state employees to state population. As the state's population has grown rapidly over the past decade, the number of state employees has grown more slowly. 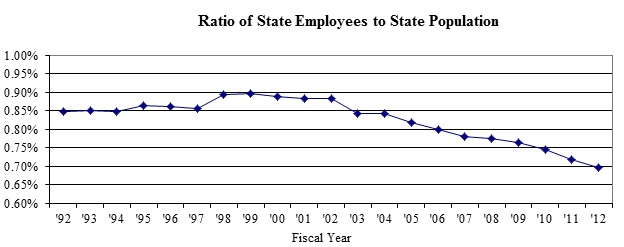
Note: The chart shows a declining ratio of state employees to state population, thus suggesting increased efficiency of the state workforce.
Measure: Ratio of State Population to State Employees.
Goal: Limit the growth of the State workforce to less than 0.8% of the state population.
Methodology: Divide the number of state Full-Time Equivalent (FTE)
positions by the total state population.
Measure Type: Outcome. Funding Detail The department utilizes funding from the General Fund and Dedicated Credits. Dedicated Credits are collected from training fees. Most of the department funding is used for staff support and IT costs. Sources of Finance
(click linked fund name for more info) | 2009
Actual | 2010
Actual | 2011
Actual | 2012
Actual | 2013
Approp | | General Fund | $3,395,800 | $3,073,600 | $2,963,500 | $2,895,900 | $2,986,000 | | General Fund, One-time | $207,100 | ($54,300) | $450,000 | $0 | $0 | | Dedicated Credits Revenue | $263,400 | $143,300 | $165,400 | $175,700 | $400,000 | | Beginning Nonlapsing | $512,800 | $506,100 | $460,200 | $508,300 | $0 | | Closing Nonlapsing | ($506,100) | ($460,200) | ($508,300) | ($547,900) | $0 | | Lapsing Balance | ($243,500) | ($299,600) | ($217,600) | ($382,800) | $0 | | Total | $3,629,500 | $2,908,900 | $3,313,200 | $2,649,200 | $3,386,000 |
|---|
| | | | | | Programs:
(click linked program name to drill-down) | 2009
Actual | 2010
Actual | 2011
Actual | 2012
Actual | 2013
Approp |
|---|
| Administration | $822,200 | $779,800 | $1,284,900 | $682,200 | $869,600 | | Policy | $1,188,400 | $751,200 | $718,500 | $718,300 | $743,700 | | Teacher Salary Supplement | $0 | $104,500 | $95,500 | $108,600 | $228,400 | | Classification and Employee Relations | $196,200 | $0 | $0 | $0 | $0 | | Statewide Management Liability Training | $270,100 | $189,200 | $161,200 | $144,100 | $400,000 | | Information Technology | $1,152,600 | $1,084,200 | $1,053,100 | $996,000 | $1,144,300 | | Total | $3,629,500 | $2,908,900 | $3,313,200 | $2,649,200 | $3,386,000 |
|---|
| | | | | | Categories of Expenditure
(mouse-over category name for definition) | 2009
Actual | 2010
Actual | 2011
Actual | 2012
Actual | 2013
Approp |
|---|
| Personnel Services | $1,977,000 | $1,527,600 | $1,500,600 | $1,460,400 | $1,518,800 | | In-state Travel | $1,800 | $11,700 | $1,000 | $1,700 | $8,000 | | Out-of-state Travel | $21,100 | $10,200 | $14,200 | $8,900 | $79,000 | | Current Expense | $399,500 | $269,900 | $804,700 | $309,100 | $624,500 | | DP Current Expense | $1,230,100 | $1,089,500 | $1,055,700 | $1,003,500 | $1,218,700 | | Other Charges/Pass Thru | $0 | $0 | ($63,000) | ($134,400) | ($63,000) | | Total | $3,629,500 | $2,908,900 | $3,313,200 | $2,649,200 | $3,386,000 |
|---|
| | | | | | | Other Indicators | 2009
Actual | 2010
Actual | 2011
Actual | 2012
Actual | 2013
Approp |
|---|
| Budgeted FTE | 26.0 | 24.8 | 25.0 | 24.0 | 25.0 | | Actual FTE | 22.5 | 17.2 | 16.6 | 15.9 | 0.0 |
|
|
|
|
|
|
|---|
Subcommittee Table of ContentsProgram: Administration Function The Administration program oversees the goals, plans, and implementation of policy for the entire department as well as statewide issues. Functions include workforce planning; coordination with the governor's office and Legislature on key issues; public information and dissemination; budget oversight and control; and oversight of classification, compensation, benefits, recruitment and selection, training and development, employee relations, and HR-related liability management, and statewide workforce planning. Funding Detail Sources of Finance
(click linked fund name for more info) | 2009
Actual | 2010
Actual | 2011
Actual | 2012
Actual | 2013
Approp | | General Fund | $740,500 | $981,800 | $920,500 | $908,800 | $869,600 | | General Fund, One-time | $183,100 | ($127,900) | $450,000 | $0 | $0 | | Lapsing Balance | ($101,400) | ($74,100) | ($85,600) | ($226,600) | $0 | | Total | $822,200 | $779,800 | $1,284,900 | $682,200 | $869,600 |
|---|
| | | | | | Categories of Expenditure
(mouse-over category name for definition) | 2009
Actual | 2010
Actual | 2011
Actual | 2012
Actual | 2013
Approp |
|---|
| Personnel Services | $680,200 | $666,800 | $677,500 | $626,200 | $655,700 | | In-state Travel | $400 | $200 | $0 | $700 | $2,200 | | Out-of-state Travel | $5,700 | $4,900 | $8,700 | $6,600 | $18,000 | | Current Expense | $134,500 | $104,300 | $661,600 | $180,500 | $256,600 | | DP Current Expense | $1,400 | $3,600 | $100 | $2,600 | $100 | | Other Charges/Pass Thru | $0 | $0 | ($63,000) | ($134,400) | ($63,000) | | Total | $822,200 | $779,800 | $1,284,900 | $682,200 | $869,600 |
|---|
| | | | | | | Other Indicators | 2009
Actual | 2010
Actual | 2011
Actual | 2012
Actual | 2013
Approp |
|---|
| Budgeted FTE | 10.0 | 8.5 | 9.0 | 8.5 | 9.0 | | Actual FTE | 7.4 | 6.8 | 6.8 | 5.8 | 0.0 |
|
|
|
|
|
|
|---|
Subcommittee Table of ContentsProgram: Policy Function The Policy program provides oversight and development of the following functions: recruiting; selection; employee development; employee relations, fair employment practices, compensation and benefits, classification, diversity and liability prevention.
The functions performed by this program affect the working life of all state employees in terms of salaries and working conditions. Performance
Benefits
| |
Purpose/Definition |
FY 2010 |
FY 2011 |
FY 2012 |
FY 2013 |
| Benefits Comparison to Market |
State benefits compared to market |
19.5%* |
19.5%* |
19.0% |
19.0%* |
| # of Retirements Processed |
Number of retirees processed |
528 |
506 |
479 |
|
| Increase/Decrease in Medical Premiums Per Year |
% the State's medical insurance premiums have increased/decreased |
3.2% |
6.0% |
-2.0% |
0.0% |
*Survey source changed from Mercer to the Bureau of Labor Statistics. BLS is not our ideal source for benefits data, which is one reason why DHRM has contracted with the Hay Group to do a comprehensive study of employee total compensation. FY 12 projection is based off of the Hay Group study, using average salary of $45,000. For FY 13 the plan updates every other year. An FY 14 source for data has not yet been determined.
** PEHP has not yet put projections together for FY 14.
|
Classification
| |
Purpose/Definition |
FY 2010 |
FY 2011 |
FY 2012 |
FY 2013 |
| # of Employees Reclassified |
# of employees whose jobs were reviewed and approved for a change in job title |
247 |
171 |
240 |
234 |
| # of Classification Grievances |
# of employees who filed a formal classification grievance |
1 |
2 |
1 |
2 |
| # of New Jobs |
# of new job titles created minus # of job titles eliminated |
37 |
17* |
-53** |
36 |
*Survey source changed from Mercer to the Bureau of Labor Statistics. BLS is not our ideal source for benefits data, which is one reason why DHRM has contracted with the Hay Group to do a comprehensive study of employee total compensation. FY 12 projection is based off of the Hay Group study, using average salary of $45,000. For FY 13 the plan updates every other year. An FY 14 source for data has not yet been determined.
** PEHP has not yet put projections together for FY 14.
|
Compensation
| |
Purpose/Definition |
FY 2010 |
FY 2011 |
FY 2012 |
FY 2013 |
| Actual Wages Compared to Market |
State of Utah employee salaries compared to similar positions in the market |
-15.2% |
-15.8% |
-18.3% |
* |
| Salary Ranges Compared to Market |
State of Utah salary ranges compared to similar positions in the market |
-10.2% |
-10.7% |
-13.6% |
* |
| Total Compensation Compared to Market |
State of Utah's total compensation package compared to market |
N/A |
N/A |
-6.0% |
-6.0%** |
* DHRM's annual total compensation plan with recommendations and survey results will be presented to GOPB by the end of October 2012.
** DHRM plans to use the Hay Group every other year, with no other valid method to determine total comp, these figures will remain the same until Hay survey's the market for FY 14.
|
Funding Detail Sources of Finance
(click linked fund name for more info) | 2009
Actual | 2010
Actual | 2011
Actual | 2012
Actual | 2013
Approp | | General Fund | $1,246,200 | $709,000 | $739,600 | $756,800 | $743,700 | | General Fund, One-time | $12,000 | $74,400 | $0 | $0 | $0 | | Lapsing Balance | ($69,800) | ($32,200) | ($21,100) | ($38,500) | $0 | | Total | $1,188,400 | $751,200 | $718,500 | $718,300 | $743,700 |
|---|
| | | | | | Categories of Expenditure
(mouse-over category name for definition) | 2009
Actual | 2010
Actual | 2011
Actual | 2012
Actual | 2013
Approp |
|---|
| Personnel Services | $1,185,400 | $759,500 | $728,800 | $732,400 | $751,300 | | In-state Travel | $1,000 | $1,400 | $700 | $1,000 | $300 | | Out-of-state Travel | $5,300 | $1,500 | $1,100 | $2,000 | $8,000 | | Current Expense | $26,700 | $18,800 | $17,900 | $12,900 | $14,100 | | Other Charges/Pass Thru | ($30,000) | ($30,000) | ($30,000) | ($30,000) | ($30,000) | | Total | $1,188,400 | $751,200 | $718,500 | $718,300 | $743,700 |
|---|
| | | | | | | Other Indicators | 2009
Actual | 2010
Actual | 2011
Actual | 2012
Actual | 2013
Approp |
|---|
| Budgeted FTE | 16.0 | 14.5 | 14.0 | 13.5 | 14.0 | | Actual FTE | 13.1 | 8.6 | 8.0 | 8.2 | 0.0 |
|
|
|
|
|
|
|---|
Subcommittee Table of ContentsProgram: Teacher Salary Supplement Function The Teacher Salary Supplement program was created in the 2008 General Session to provide bonuses to math and science teachers in the public education system who meet certain criteria specified in the statute. DHRM's role is to administer the program by creating an online application system, verifying teacher eligibility, determining the amount of the bonuses to be received, and then working with State Finance to have funding dispersed to applicable local education agencies for disbursement to qualifying teachers. DHRM is allocated funding to provide for staff time and IT resources. The funding for the bonuses themselves is given to the Division of Finance. Funding Detail Sources of Finance
(click linked fund name for more info) | 2009
Actual | 2010
Actual | 2011
Actual | 2012
Actual | 2013
Approp | | General Fund | $0 | $205,000 | $206,400 | $226,300 | $228,400 | | Lapsing Balance | $0 | ($100,500) | ($110,900) | ($117,700) | $0 | | Total | $0 | $104,500 | $95,500 | $108,600 | $228,400 |
|---|
| | | | | | Categories of Expenditure
(mouse-over category name for definition) | 2009
Actual | 2010
Actual | 2011
Actual | 2012
Actual | 2013
Approp |
|---|
| Personnel Services | $0 | $101,300 | $94,300 | $101,800 | $111,800 | | In-state Travel | $0 | $100 | $0 | $0 | $500 | | Out-of-state Travel | $0 | $0 | $0 | $0 | $3,000 | | Current Expense | $0 | $1,100 | $1,200 | $1,400 | $48,800 | | DP Current Expense | $0 | $2,000 | $0 | $5,400 | $64,300 | | Total | $0 | $104,500 | $95,500 | $108,600 | $228,400 |
|---|
| | | | | | | Other Indicators | 2009
Actual | 2010
Actual | 2011
Actual | 2012
Actual | 2013
Approp |
|---|
| Budgeted FTE | 0.0 | 1.8 | 2.0 | 2.0 | 2.0 | | Actual FTE | 0.0 | 1.8 | 1.8 | 1.9 | 0.0 |
|
|
|
|
|
|
|---|
Subcommittee Table of ContentsProgram: Classification and Employee Relations Function In FY 2010, funding and operations activities were transferred to the Teacher Salary Supplement program going forward. Funding Detail Sources of Finance
(click linked fund name for more info) | 2009
Actual | 2010
Actual | 2011
Actual | 2012
Actual | 2013
Approp | | General Fund | $235,200 | $800 | $0 | $0 | $0 | | General Fund, One-time | $0 | ($800) | $0 | $0 | $0 | | Lapsing Balance | ($39,000) | $0 | $0 | $0 | $0 | | Total | $196,200 | $0 | $0 | $0 | $0 |
|---|
| | | | | | Categories of Expenditure
(mouse-over category name for definition) | 2009
Actual | 2010
Actual | 2011
Actual | 2012
Actual | 2013
Approp |
|---|
| Personnel Services | $111,400 | $0 | $0 | $0 | $0 | | In-state Travel | $100 | $0 | $0 | $0 | $0 | | Current Expense | $1,000 | $0 | $0 | $0 | $0 | | DP Current Expense | $83,700 | $0 | $0 | $0 | $0 | | Total | $196,200 | $0 | $0 | $0 | $0 |
|---|
| | | | | | | Other Indicators | 2009
Actual | 2010
Actual | 2011
Actual | 2012
Actual | 2013
Approp |
|---|
| Actual FTE | 2.0 | 0.0 | 0.0 | 0.0 | 0.0 |
|
|
|
|
|
|
|---|
Subcommittee Table of ContentsProgram: Statewide Management Liability Training Function Statewide Management Liability Training provides opportunities and resources available to agencies across the state to meet workforce needs including: - courses and workshops for supervisors and managers to sharpen knowledge and implement skills in liability reduction, leadership, communication, and workplace processes;
- conferences and symposia for managers and human resource professionals to receive current information and data on workplace liability, leadership, and management practices;
- customized training at the request of any work unit to build business and management skills in the organization;
- business consultation for work unit leaders to advance strategic solutions or examine work unit processes for improvement;
- professional coaching for managers and leadership teams to improve operational and behavioral effectiveness;
- work units to access speakers or facilitators for leadership, management and liability reduction related topics or processes.
Funding Detail The program is funded through Dedicated Credit revenue generated by fees for services provided. Sources of Finance
(click linked fund name for more info) | 2009
Actual | 2010
Actual | 2011
Actual | 2012
Actual | 2013
Approp | | Dedicated Credits Revenue | $263,400 | $143,300 | $165,400 | $175,700 | $400,000 | | Beginning Nonlapsing | $250,600 | $243,900 | $198,000 | $202,200 | $0 | | Closing Nonlapsing | ($243,900) | ($198,000) | ($202,200) | ($233,800) | $0 | | Total | $270,100 | $189,200 | $161,200 | $144,100 | $400,000 |
|---|
| | | | | | Categories of Expenditure
(mouse-over category name for definition) | 2009
Actual | 2010
Actual | 2011
Actual | 2012
Actual | 2013
Approp |
|---|
| In-state Travel | $300 | $10,000 | $300 | $0 | $5,000 | | Out-of-state Travel | $4,000 | $3,800 | $4,400 | $300 | $50,000 | | Current Expense | $235,800 | $145,400 | $124,000 | $113,800 | $305,000 | | DP Current Expense | $0 | $0 | $2,500 | $0 | $10,000 | | Other Charges/Pass Thru | $30,000 | $30,000 | $30,000 | $30,000 | $30,000 | | Total | $270,100 | $189,200 | $161,200 | $144,100 | $400,000 |
|---|
Subcommittee Table of ContentsProgram: Information Technology Function Information Technology provides the automated systems that comprise the enterprise Human Resource Management Information system. This system provides support to all agencies relative to employee recruitment, employment, pay, and all other employee related functions. Statewide systems supported by DHRM include: - HRE (Human Resource Enterprise)
- TRM (Training Records Management)
- Employee Gateway
- HR Data Warehouse
- UJM (Utah Job Match)
- UJM Job & Position Analysis
- Lifestyle Benefits
- UMD (Utah Master Directory)
- HREventure Events Management System
- Teacher Salary Supplement Program Website
- Utah Performance Management
- Employee Resource Information Center (ERIC)
The Information Technology program provides the technology support for the department. It provides support for internal DHRM needs as well as other state agencies in processing HR business. This includes processing from recruitment through termination. The program provides direct access to human resource information to employees. It also provides information to the public and employees through the Web. Funding Detail In FY 2007 all five FTE in this program transferred to the new Department of Technology Services; which bills for the services previously performed by this division to DHRM as current expenses. Sources of Finance
(click linked fund name for more info) | 2009
Actual | 2010
Actual | 2011
Actual | 2012
Actual | 2013
Approp | | General Fund | $1,173,900 | $1,177,000 | $1,097,000 | $1,004,000 | $1,144,300 | | General Fund, One-time | $12,000 | $0 | $0 | $0 | $0 | | Beginning Nonlapsing | $262,200 | $262,200 | $262,200 | $306,100 | $0 | | Closing Nonlapsing | ($262,200) | ($262,200) | ($306,100) | ($314,100) | $0 | | Lapsing Balance | ($33,300) | ($92,800) | $0 | $0 | $0 | | Total | $1,152,600 | $1,084,200 | $1,053,100 | $996,000 | $1,144,300 |
|---|
| | | | | | Categories of Expenditure
(mouse-over category name for definition) | 2009
Actual | 2010
Actual | 2011
Actual | 2012
Actual | 2013
Approp |
|---|
| Out-of-state Travel | $6,100 | $0 | $0 | $0 | $0 | | Current Expense | $1,500 | $300 | $0 | $500 | $0 | | DP Current Expense | $1,145,000 | $1,083,900 | $1,053,100 | $995,500 | $1,144,300 | | Total | $1,152,600 | $1,084,200 | $1,053,100 | $996,000 | $1,144,300 |
|---|
Subcommittee Table of Contents |