Compendium of Budget Information for the 2013 General Session
| Natural Resources, Agriculture, & Environmental Quality Appropriations Subcommittee | ||||||||||||||||||||||||||||||||||||||||||||||||||||||||||||||||||||||||||||||||||||||||||||||||||||||||||||||||||||||||||||||||||||||||||||||||||||||||||||
| <-Previous Page | Subcommittee Table of Contents | Next Page-> | ||||||||||||||||||||||||||||||||||||||||||||||||||||||||||||||||||||||||||||||||||||||||||||||||||||||||||||||||||||||||||||||||||||||||||||||||||||||||||||
Line Item: Cooperative Agreements Function This line item accounts for spending on studies done in cooperation with federal agencies, local government agencies, or other entities. The agencies supply the funding and DWR provides field teams to conduct the studies. Therefore, FTEs can fluctuate up or down depending on the number of projects. Performance This measure tracks the funding contracted through this line item. Most of the research and data collected benefits both the division and the party providing the funds. 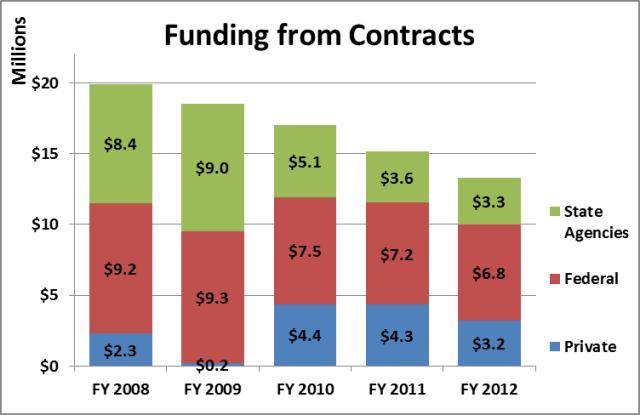 Funding Detail The largest contributions have come from the Watershed Initiative, BLM, US Fish and Wildlife Services, Washington County, Division of Oil, Gas, and Mining, and Ruby Pipeline Co. Over 80% of the funding is used for wildlife habitat improvement projects. The Legislature appropriates these funds, but since they are not "state funds" receipt of the funds depends on non-state entities. The division can only spend what funding it receives in this line item each fiscal year.
| ||||||||||||||||||||||||||||||||||||||||||||||||||||||||||||||||||||||||||||||||||||||||||||||||||||||||||||||||||||||||||||||||||||||||||||||||||||||||||||
| <-Previous Page | Next Page-> |
COBI contains unaudited data as presented to the Legislature by state agencies at the time of publication. For audited financial data see the State of Utah's Comprehensive Annual Financial Reports.