Agency: ISF - Administrative Services Line Item: ISF - Fleet Operations Function The Division of Fleet Operations was established as a new division of Administrative Services in 1997. Fleet is charged with handling state vehicle acquisition, repair, preventive maintenance, surplus, and fueling of state vehicles. For FY 2012 the Department of Administrative Services made several changes that affect the Division of Fleet Operations. First, the department moved the Travel Office from the Division of Finance to Fleet Operations. Second the department moved State Surplus Property and Federal Surplus Property programs from Fleet Operations to the Division of General Services internal service fund. Statutory Authority UCA 63A Chapter 9 creates the Division of Fleet Operations (Section 201) and delineates the division's duties (Section 401). Duties include: - Perform all administrative duties related to managing the state's vehicles
- Coordinate all purchases of state vehicles
- Establish fleet information system(s) for state vehicles
- Make rules regarding maintenance, safety, loss prevention, procurement, fuel management, cost management, disposal, reallocation, rate structures, and insurance requirements for state vehicles
- Establish a parts inventory
- Create and administer a fuel dispensing service
- Emphasize customer service
- Conduct an annual audit of all state vehicles
- Charge rates approved by the Rate Committee and Legislature
- Conduct a market analysis
- By November 1 of each year submit a state-owned vehicle report to the Governor and Legislative Fiscal Analyst
UCA 63A-9-601 requires the division to ensure that vehicles owned or leased by the state are properly marked UCA 63A-9-401.5 requires the division to develop and coordinate the implementation of a statewide vehicle fleet cost efficiency plan, which includes: - Goals for vehicle fleet cost efficiency
- A summary of agency submitted, plans, statistics, and progress
- Standard measures of cost including vehicle cost per mile, total vehicles, total fuel used, and miles per gallon
- Goals for purchasing the most economically appropriate size and type of vehicle
- Cost reduction measures
- reducing inventories of underutilized vehicles
Intent Language Under Section 63J-1-603 of the Utah Code the Legislature intends that appropriations provided for the Department of Administrative Services -- Division of Fleet Operations in Item 42 of Chapter 2 Laws of Utah 2010 not lapse capital outlay authority granted within Fiscal Year 2011 for vehicles not delivered by the end of Fiscal Year 2011 in which vehicle purchase orders were issued obligating capital outlay funds. Performance Administration costs should be kept as low as possible so resources can be used for providing services to customer agencies. 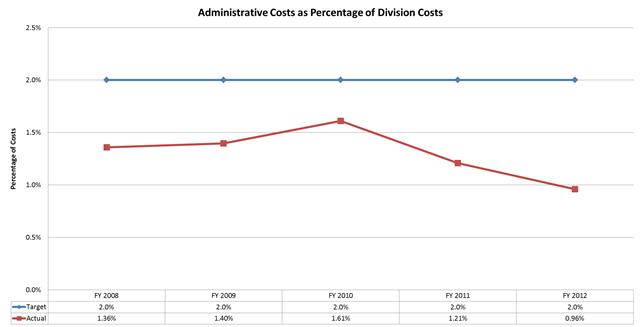 Funding Detail This budgetary line item contains four programs; however, the Administration program exists only to account for overhead costs of services provided to the other three programs. The large retained earnings come primarily from the Fuel Network program and will be address in FY 2012 through rate reductions and by rebating some of the earnings back to the General Fund and the federal government. Sources of Finance
(click linked fund name for more info) | 2009
Actual | 2010
Actual | 2011
Actual | 2012
Actual | 2013
Approp | | Federal Funds | $0 | $0 | $273,000 | $18,500 | $0 | | Dedicated Credits - Intragvt Rev | $60,198,900 | $55,466,700 | $62,174,700 | $64,649,500 | $62,248,000 | | Sale of Fixed Assets | ($179,700) | ($1,351,100) | $384,200 | $582,900 | $0 | | Total | $60,019,200 | $54,115,600 | $62,831,900 | $65,250,900 | $62,248,000 |
|---|
| | | | | | Programs:
(click linked program name to drill-down) | 2009
Actual | 2010
Actual | 2011
Actual | 2012
Actual | 2013
Approp |
|---|
| ISF - Motor Pool | $26,765,500 | $23,268,900 | $26,362,800 | $24,556,200 | $25,843,700 | | ISF - Fuel Network | $33,253,700 | $30,846,700 | $36,469,100 | $40,172,000 | $35,878,000 | | ISF - Travel Office | $0 | $0 | $0 | $522,700 | $526,300 | | Total | $60,019,200 | $54,115,600 | $62,831,900 | $65,250,900 | $62,248,000 |
|---|
| | | | | | Categories of Expenditure
(mouse-over category name for definition) | 2009
Actual | 2010
Actual | 2011
Actual | 2012
Actual | 2013
Approp |
|---|
| Personnel Services | $2,062,500 | $1,992,200 | $1,876,100 | $2,034,900 | $1,877,200 | | In-state Travel | $6,000 | $1,500 | $300 | $400 | $300 | | Out-of-state Travel | $4,100 | $2,600 | $2,700 | $9,700 | $7,400 | | Current Expense | $47,109,400 | $43,393,100 | $49,628,100 | $56,827,500 | $50,250,300 | | DP Current Expense | $585,600 | $595,700 | $576,300 | $595,100 | $645,200 | | Other Charges/Pass Thru | $50,300 | $37,700 | $40,300 | $379,200 | $100,800 | | Depreciation | $10,081,900 | $10,476,100 | $8,996,600 | $9,398,900 | $9,424,700 | | Transfers | $1,436,500 | $0 | $0 | $2,000,000 | $0 | | Total | $61,336,300 | $56,498,900 | $61,120,400 | $71,245,700 | $62,305,900 |
|---|
| | | | | | | Other Indicators | 2009
Actual | 2010
Actual | 2011
Actual | 2012
Actual | 2013
Approp |
|---|
| Budgeted FTE | 29.2 | 29.0 | 28.7 | 31.3 | 26.6 | | Actual FTE | 26.6 | 25.3 | 24.4 | 26.5 | 0.0 | | Authorized Capital Outlay | $11,707,200 | $13,290,600 | $16,625,800 | $16,922,200 | $21,382,000 | | Retained Earnings | $11,172,300 | $8,788,800 | $10,503,800 | $4,508,900 | $4,010,400 | | Vehicles | 8 | 11 | 11 | 15 | 11 |
|
|
|
|
|
|
|---|
Subcommittee Table of ContentsProgram: ISF - Fleet Administration Function The Administration program is responsible for the managemen of all programs within the Division of Fleet Operations. This program is also responsible for billing and associated activities. It coordinates the annual rate package and distributes the annual budget for the division. Funding Detail All expenses in this program are passed through to the programs in proportion to their share of the total division budget (excluding cost of goods sold). Sources of Finance
(click linked fund name for more info) | 2009
Actual | 2010
Actual | 2011
Actual | 2012
Actual | 2013
Approp | | Total | $0 | $0 | $0 | $0 | $0 |
|---|
| | | | | | Categories of Expenditure
(mouse-over category name for definition) | 2009
Actual | 2010
Actual | 2011
Actual | 2012
Actual | 2013
Approp |
|---|
| Personnel Services | $531,700 | $576,500 | $410,300 | $319,600 | $24,200 | | Out-of-state Travel | $2,300 | $900 | $200 | $6,800 | $2,800 | | Current Expense | $79,800 | $53,700 | $59,600 | $107,100 | $440,100 | | DP Current Expense | $115,900 | $126,900 | $102,000 | $106,400 | $221,100 | | Other Charges/Pass Thru | ($729,700) | ($758,000) | ($572,100) | ($539,900) | ($688,200) | | Total | $0 | $0 | $0 | $0 | $0 |
|---|
| | | | | | | Other Indicators | 2009
Actual | 2010
Actual | 2011
Actual | 2012
Actual | 2013
Approp |
|---|
| Budgeted FTE | 5.7 | 5.0 | 5.0 | 3.7 | (1.3) | | Actual FTE | 4.6 | 4.6 | 3.8 | 2.9 | 0.0 | | Retained Earnings | $9,100 | $9,100 | $9,100 | $9,100 | $9,100 |
|
|
|
|
|
|
|---|
Subcommittee Table of ContentsProgram: ISF - Motor Pool Function This program is responsible for the management of the statewide fleet, the central motor pool, safety objectives/compliance, and the statewide fleet management information system. The motor pool accounts for all state vehicles, even though a portion of those vehicles are administered in higher education fleets. The program also administers the vehicle accident management program and complies with the federal Energy Policy Act. Performance As an internal service fund, the Motor Pool program is required to set rates so that revenues match expenditures. Return on Investment is measured by dividing the net of gains minus investment cost by investment cost. 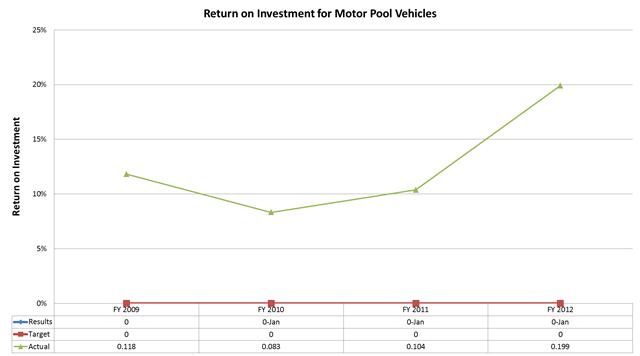 Funding Detail Sources of Finance
(click linked fund name for more info) | 2009
Actual | 2010
Actual | 2011
Actual | 2012
Actual | 2013
Approp | | Federal Funds | $0 | $0 | $273,000 | $8,000 | $0 | | Dedicated Credits - Intragvt Rev | $26,945,200 | $24,620,000 | $25,705,600 | $23,965,300 | $25,843,700 | | Sale of Fixed Assets | ($179,700) | ($1,351,100) | $384,200 | $582,900 | $0 | | Total | $26,765,500 | $23,268,900 | $26,362,800 | $24,556,200 | $25,843,700 |
|---|
| | | | | | Categories of Expenditure
(mouse-over category name for definition) | 2009
Actual | 2010
Actual | 2011
Actual | 2012
Actual | 2013
Approp |
|---|
| Personnel Services | $939,000 | $832,100 | $846,600 | $925,000 | $1,060,900 | | In-state Travel | $6,000 | $1,300 | $0 | $200 | $0 | | Out-of-state Travel | $1,800 | $1,700 | $2,500 | $2,000 | $2,600 | | Current Expense | $15,303,000 | $14,094,500 | $15,261,800 | $16,467,500 | $15,184,100 | | DP Current Expense | $413,300 | $423,700 | $422,500 | $427,700 | $331,700 | | Other Charges/Pass Thru | $435,200 | $339,600 | $293,300 | $263,900 | $376,700 | | Depreciation | $9,932,400 | $10,290,800 | $8,820,700 | $9,214,100 | $9,208,700 | | Total | $27,030,700 | $25,983,700 | $25,647,400 | $27,300,400 | $26,164,700 |
|---|
| | | | | | | Other Indicators | 2009
Actual | 2010
Actual | 2011
Actual | 2012
Actual | 2013
Approp |
|---|
| Budgeted FTE | 15.2 | 15.0 | 15.1 | 16.4 | 16.7 | | Actual FTE | 13.7 | 12.5 | 12.0 | 13.1 | 0.0 | | Authorized Capital Outlay | $11,643,600 | $12,724,900 | $16,436,900 | $16,859,200 | $21,032,000 | | Retained Earnings | $5,875,500 | $3,160,600 | $3,879,500 | $1,135,100 | $1,015,800 | | Vehicles | 6 | 9 | 9 | 12 | 9 |
|
|
|
|
|
|
|---|
Subcommittee Table of ContentsProgram: ISF - Fuel Network Function The Fuel Network manages the state's fuel purchase contracts and the state's fuel infrastructure; which includes the statewide underground storage tank program and consolidated electronic refueling stations. The Fuel Network uses capital outlay authorizations primarily to replace card readers and fuel tank monitors. Performance The state's fuel network adds value only if fueling sites are operational. The Fuel Network program strives for zero downtime except for scheduled maintenance. 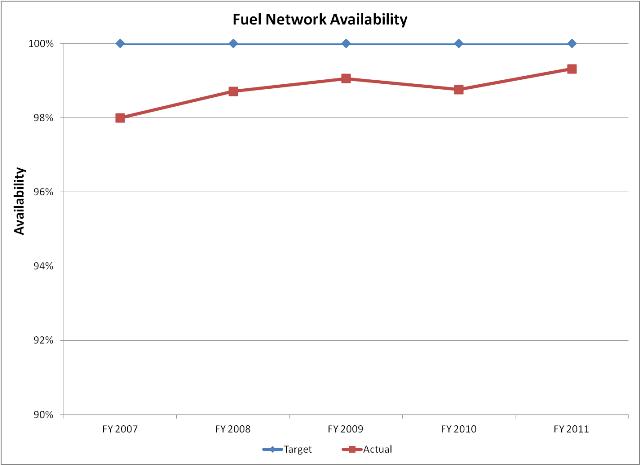 Funding Detail Historical increases and decreases in revenues and expenditures have largely been attributable to fuel costs; not to changes in consumption. Sources of Finance
(click linked fund name for more info) | 2009
Actual | 2010
Actual | 2011
Actual | 2012
Actual | 2013
Approp | | Federal Funds | $0 | $0 | $0 | $10,500 | $0 | | Dedicated Credits - Intragvt Rev | $33,253,700 | $30,846,700 | $36,469,100 | $40,161,500 | $35,878,000 | | Total | $33,253,700 | $30,846,700 | $36,469,100 | $40,172,000 | $35,878,000 |
|---|
| | | | | | Categories of Expenditure
(mouse-over category name for definition) | 2009
Actual | 2010
Actual | 2011
Actual | 2012
Actual | 2013
Approp |
|---|
| Personnel Services | $591,800 | $583,600 | $619,200 | $625,800 | $624,800 | | In-state Travel | $0 | $200 | $300 | $200 | $300 | | Out-of-state Travel | $0 | $0 | $0 | $400 | $800 | | Current Expense | $31,726,600 | $29,244,900 | $34,306,700 | $39,922,100 | $34,337,900 | | DP Current Expense | $56,400 | $45,100 | $51,800 | $50,900 | $67,200 | | Other Charges/Pass Thru | $344,800 | $456,100 | $319,100 | $649,300 | $402,300 | | Depreciation | $149,500 | $185,300 | $175,900 | $184,800 | $216,000 | | Transfers | $1,436,500 | $0 | $0 | $2,000,000 | $0 | | Total | $34,305,600 | $30,515,200 | $35,473,000 | $43,433,500 | $35,649,300 |
|---|
| | | | | | | Other Indicators | 2009
Actual | 2010
Actual | 2011
Actual | 2012
Actual | 2013
Approp |
|---|
| Budgeted FTE | 8.3 | 9.0 | 8.6 | 9.2 | 9.2 | | Actual FTE | 8.3 | 8.3 | 8.6 | 8.6 | 0.0 | | Authorized Capital Outlay | $63,600 | $565,700 | $188,900 | $63,000 | $350,000 | | Retained Earnings | $5,287,700 | $5,619,100 | $6,615,200 | $3,353,800 | $2,897,200 | | Vehicles | 2 | 2 | 2 | 3 | 2 |
|
|
|
|
|
|
|---|
Subcommittee Table of ContentsProgram: ISF - Travel Office Function The Travel Office is responsible for arranging travel for state employees and employees of political subdivisions that choose to participate. Airline tickets, hotels, rental vehicles, and conference sites are ticketed and arranged for by this office. The Office contracts with a private sector travel agency which is on-site in the State Office Building. In the 2010 General Session the Legislature allowed the Department of Administrative Services to move this program from the Division of Finance's appropriated budget to an internal service fund managed by the Division of Fleet Operations as requested. Funding Detail Funding for this program comes from fees charged to user agencies or entities for travel services. Prior to FY 2012 this program was administered by the Division of Finance. Sources of Finance
(click linked fund name for more info) | 2009
Actual | 2010
Actual | 2011
Actual | 2012
Actual | 2013
Approp | | Dedicated Credits - Intragvt Rev | $0 | $0 | $0 | $522,700 | $526,300 | | Total | $0 | $0 | $0 | $522,700 | $526,300 |
|---|
| | | | | | Categories of Expenditure
(mouse-over category name for definition) | 2009
Actual | 2010
Actual | 2011
Actual | 2012
Actual | 2013
Approp |
|---|
| Personnel Services | $0 | $0 | $0 | $164,500 | $167,300 | | Out-of-state Travel | $0 | $0 | $0 | $500 | $1,200 | | Current Expense | $0 | $0 | $0 | $330,800 | $288,200 | | DP Current Expense | $0 | $0 | $0 | $10,100 | $25,200 | | Other Charges/Pass Thru | $0 | $0 | $0 | $5,900 | $10,000 | | Total | $0 | $0 | $0 | $511,800 | $491,900 |
|---|
| | | | | | | Other Indicators | 2009
Actual | 2010
Actual | 2011
Actual | 2012
Actual | 2013
Approp |
|---|
| Budgeted FTE | 0.0 | 0.0 | 0.0 | 2.0 | 2.0 | | Actual FTE | 0.0 | 0.0 | 0.0 | 1.9 | 0.0 | | Retained Earnings | $0 | $0 | $0 | $10,900 | $88,300 |
|
|
|
|
|
|
|---|
Subcommittee Table of Contents |