Agency: ISF - Administrative Services Line Item: ISF - Purchasing & General Services Function In 1997, the Legislature reorganized the Department of Administrative Services, which merged Central Copying, Central Mail, and Central Stores into the Division of Purchasing. The new division became the Division of Purchasing and General Services. The General Services functions of the division are budgeted as internal service funds. The procurement function that enables other agencies to contract for goods and services is budgeted separately in the appropriated fund section. In FY 2011, the department requested that the State Surplus Property and the Federal Surplus Property internal service funds be moved from the Division of Fleet Operations to the Division of General Services to more closely align program operations with similar programs. The Department also requested that the Purchasing Card (P-Card) program be moved from the Electronic Purchasing program to a new internal service fund administered by the Division of Finance in FY 2011. The Legislature accommodated these requests in the 2010 General Session. The programs in this line item include: - Administration
- Central Mailing
- Electronic Purchasing
- Print Services
- State Surplus Property
- Federal Surplus Property
Statutory Authority UCA 63A-2-103 directs the Division of Purchasing and General Services to operate and maintain: - A central mailing service
- An electronic central store system for procuring goods and services
The director may establish microfilming, duplicating, printing, addressograph, and other central services. Each state agency must subscribe to the division's central services unless the director delegates this authority as required by UCA 63A-2-104. UCA 63A-2-401 allows the division to establish a federal surplus property system UCA 63A-2-404 requires the division to establish a state surplus property system Regarding the ISF, UCA 63A-2-103(3) requires the director to: - Establish a schedule of fees for services provided to any department or agency
- Submit proposed fees for services to the Rate Committee and obtain approval from the Legislature
- Ensure that fees are approximately equal to the cost of providing the service
- Conduct a market analysis of fees that compares division rates with fees of other public or private sector providers
Funding Detail This budgetary line item contains six programs. However, the Administration program exists only to account for overhead costs of services provided to the other five programs. It does not appear in the budget detail below because its revenues and expenditures usually net to zero. Sources of Finance
(click linked fund name for more info) | 2009
Actual | 2010
Actual | 2011
Actual | 2012
Actual | 2013
Approp | | Dedicated Credits - Intragvt Rev | $17,621,200 | $17,205,100 | $18,068,300 | $19,575,000 | $19,069,000 | | Sale of Fixed Assets | ($12,100) | $6,100 | $10,300 | $15,600 | $0 | | Total | $17,609,100 | $17,211,200 | $18,078,600 | $19,590,600 | $19,069,000 |
|---|
| | | | | | Programs:
(click linked program name to drill-down) | 2009
Actual | 2010
Actual | 2011
Actual | 2012
Actual | 2013
Approp |
|---|
| ISF - Central Mailing | $12,487,500 | $12,461,600 | $12,463,400 | $13,166,800 | $13,187,900 | | ISF - Cooperative Contracting | $622,900 | $492,300 | $1,651,800 | $2,220,600 | $1,737,600 | | ISF - Print Services | $3,411,600 | $3,203,600 | $3,236,600 | $3,128,600 | $3,413,400 | | ISF - State Surplus Property | $1,073,200 | $944,800 | $707,200 | $1,028,500 | $707,100 | | ISF - Federal Surplus Property | $13,900 | $108,900 | $19,600 | $46,100 | $23,000 | | Total | $17,609,100 | $17,211,200 | $18,078,600 | $19,590,600 | $19,069,000 |
|---|
| | | | | | Categories of Expenditure
(mouse-over category name for definition) | 2009
Actual | 2010
Actual | 2011
Actual | 2012
Actual | 2013
Approp |
|---|
| Personnel Services | $3,336,300 | $3,333,900 | $3,503,500 | $3,678,000 | $4,606,400 | | In-state Travel | $11,600 | $8,400 | $6,000 | $3,300 | $6,200 | | Out-of-state Travel | $4,600 | $2,200 | $14,800 | $9,900 | $16,600 | | Current Expense | $12,626,500 | $12,619,600 | $12,075,100 | $12,296,100 | $12,102,000 | | DP Current Expense | $147,100 | $119,400 | $89,500 | $108,200 | $121,900 | | Capital Outlay | $0 | $0 | $147,700 | $0 | $182,600 | | Other Charges/Pass Thru | $155,100 | $96,800 | $400 | ($37,100) | ($34,900) | | Depreciation | $1,736,700 | $1,730,600 | $1,523,200 | $1,648,600 | $1,726,300 | | Total | $18,017,900 | $17,910,900 | $17,360,200 | $17,707,000 | $18,727,100 |
|---|
| | | | | | | Other Indicators | 2009
Actual | 2010
Actual | 2011
Actual | 2012
Actual | 2013
Approp |
|---|
| Budgeted FTE | 63.7 | 71.5 | 71.8 | 71.3 | 84.7 | | Actual FTE | 65.2 | 66.0 | 55.7 | 67.8 | 0.0 | | Authorized Capital Outlay | $1,695,600 | $1,058,900 | $1,759,727 | $1,436,300 | $3,510,900 | | Retained Earnings | $1,067,000 | $367,400 | $1,085,800 | $2,969,700 | $2,230,000 | | Vehicles | 22 | 23 | 16 | 25 | 23 |
|
|
|
|
|
|
|---|
Subcommittee Table of ContentsProgram: ISF - General Services Administration Function The administration program accounts for the indirect costs (administrative overhead) of delivering the services of the other three central services programs. This program manages the functions of divisional management, budgeting, accounting, and clerical support. Funding Detail All expenditures are passed through to the programs in proportion to their share of the total division budget. Sources of Finance
(click linked fund name for more info) | 2009
Actual | 2010
Actual | 2011
Actual | 2012
Actual | 2013
Approp | | Total | $0 | $0 | $0 | $0 | $0 |
|---|
| | | | | | Categories of Expenditure
(mouse-over category name for definition) | 2009
Actual | 2010
Actual | 2011
Actual | 2012
Actual | 2013
Approp |
|---|
| Personnel Services | $270,300 | $246,200 | $235,700 | $103,100 | $0 | | In-state Travel | $0 | $100 | $200 | $400 | $200 | | Out-of-state Travel | $0 | $0 | $8,100 | $0 | $8,100 | | Current Expense | $37,700 | $16,700 | $8,300 | $6,500 | $110,600 | | DP Current Expense | $60,400 | $36,100 | $0 | $6,700 | $0 | | Other Charges/Pass Thru | ($368,000) | ($295,900) | ($248,600) | ($114,700) | ($118,900) | | Total | $400 | $3,200 | $3,700 | $2,000 | $0 |
|---|
| | | | | | | Other Indicators | 2009
Actual | 2010
Actual | 2011
Actual | 2012
Actual | 2013
Approp |
|---|
| Budgeted FTE | 3.0 | 3.0 | 3.0 | 3.0 | 2.0 | | Actual FTE | 3.0 | 2.6 | 2.3 | 1.2 | 0.0 | | Retained Earnings | ($400) | ($3,700) | ($7,400) | ($9,400) | $0 |
|
|
|
|
|
|
|---|
Subcommittee Table of ContentsProgram: ISF - Central Mailing Function State Mail provides mail services for agencies throughout the state. The automation of mail functions in a centralized facility reduces the time that agencies spend on these functions and increases overall efficiency. State Mail is established to provide services in a way that minimizes costs to state agencies. Bar coding and presorting of mail allows agencies to receive maximum postal discounts. Rates reflect postal discounts obtained through mail automation and consolidation. Mail Services also provides agencies with an effective way to process their outgoing mail stream. Collation, bursting, sorting, and inserting are all automated functions performed by the division. Performance State Mail Services is primarily a production environment. Tracking freight and postage cost avoidance is one performance measure as illustrated in the following chart. 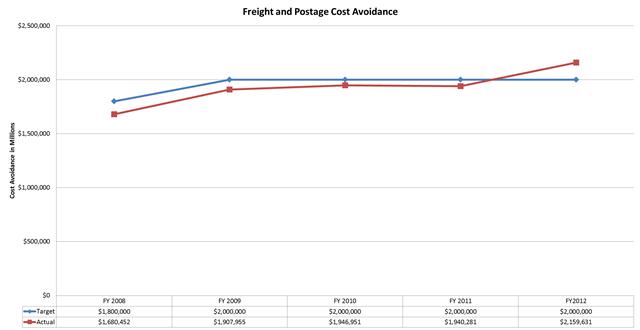 Funding Detail Sources of Finance
(click linked fund name for more info) | 2009
Actual | 2010
Actual | 2011
Actual | 2012
Actual | 2013
Approp | | Dedicated Credits - Intragvt Rev | $12,487,500 | $12,461,600 | $12,463,400 | $13,181,700 | $13,187,900 | | Sale of Fixed Assets | $0 | $0 | $0 | ($14,900) | $0 | | Total | $12,487,500 | $12,461,600 | $12,463,400 | $13,166,800 | $13,187,900 |
|---|
| | | | | | Categories of Expenditure
(mouse-over category name for definition) | 2009
Actual | 2010
Actual | 2011
Actual | 2012
Actual | 2013
Approp |
|---|
| Personnel Services | $2,089,600 | $2,101,100 | $2,195,100 | $2,238,900 | $2,316,000 | | In-state Travel | $8,400 | $5,700 | $3,200 | $900 | $3,200 | | Out-of-state Travel | $3,300 | $0 | $6,500 | $4,700 | $6,500 | | Current Expense | $10,727,600 | $10,704,000 | $10,306,200 | $10,664,500 | $10,238,100 | | DP Current Expense | $16,400 | $9,800 | $21,000 | $25,900 | $21,000 | | Capital Outlay | $0 | $0 | $147,700 | $0 | $182,600 | | Other Charges/Pass Thru | $22,900 | $23,400 | $24,100 | $24,500 | $24,100 | | Depreciation | $220,400 | $229,000 | $0 | $136,500 | $0 | | Total | $13,088,600 | $13,073,000 | $12,703,800 | $13,095,900 | $12,791,500 |
|---|
| | | | | | | Other Indicators | 2009
Actual | 2010
Actual | 2011
Actual | 2012
Actual | 2013
Approp |
|---|
| Budgeted FTE | 43.5 | 53.5 | 53.5 | 53.5 | 53.5 | | Actual FTE | 48.4 | 49.1 | 39.7 | 51.5 | 0.0 | | Authorized Capital Outlay | $149,500 | $10,700 | $418,127 | $76,900 | $530,000 | | Retained Earnings | $793,400 | $182,100 | ($58,300) | $12,600 | $550,400 | | Vehicles | 16 | 16 | 16 | 18 | 16 |
|
|
|
|
|
|
|---|
Subcommittee Table of ContentsProgram: ISF - Cooperative Contracting Function Prior to 1997, Central Stores was the state's outlet for office and specialty supplies. Beginning in 1997, office supply delivery was privatized using a cooperative contract managed by the program, and a fee added to the contract to fund management costs. Over time, additional fee-based contracts have been added. Beginning FY 2012, the program was tasked with managing all of Purchasing's Cooperative Contracts, and the program was authorized by the Legislature to collect a fee from non-state entities for use of the contracts. The Division of Purchasing has begun transitioning personnel costs from the appropriated program to this internal service fund. Beginning in FY 2012, the Division of Purchasing is transitioning personnel costs from the appropriated program to this internal service fund. The program was authorized by the Legislature to collect a fee from non-state entities using state contracts. Funding Detail Sources of Finance
(click linked fund name for more info) | 2009
Actual | 2010
Actual | 2011
Actual | 2012
Actual | 2013
Approp | | Dedicated Credits - Intragvt Rev | $622,900 | $492,300 | $1,651,800 | $2,220,600 | $1,737,600 | | Total | $622,900 | $492,300 | $1,651,800 | $2,220,600 | $1,737,600 |
|---|
| | | | | | Categories of Expenditure
(mouse-over category name for definition) | 2009
Actual | 2010
Actual | 2011
Actual | 2012
Actual | 2013
Approp |
|---|
| Personnel Services | $219,400 | $234,400 | $369,300 | $603,900 | $1,480,000 | | In-state Travel | $200 | $0 | $0 | $0 | $0 | | Out-of-state Travel | $0 | $0 | $200 | $4,400 | $0 | | Current Expense | $189,700 | $187,600 | $200,900 | $194,100 | $257,400 | | DP Current Expense | $0 | $300 | $2,100 | $4,100 | $200 | | Other Charges/Pass Thru | $263,300 | $207,300 | $104,500 | $4,900 | $0 | | Total | $672,600 | $629,600 | $677,000 | $811,400 | $1,737,600 |
|---|
| | | | | | | Other Indicators | 2009
Actual | 2010
Actual | 2011
Actual | 2012
Actual | 2013
Approp |
|---|
| Budgeted FTE | 5.0 | 3.0 | 3.0 | 3.0 | 17.5 | | Actual FTE | 2.9 | 3.0 | 4.4 | 7.3 | 0.0 | | Retained Earnings | $618,400 | $481,100 | $1,455,900 | $2,865,100 | $2,070,600 |
|
|
|
|
|
|
|---|
Subcommittee Table of ContentsProgram: ISF - Print Services Function Print Services operates a self-service copier program and contracts with Xerox to operate service centers providing high speed copying and finishing services. The program seeks to offer high quality copy services at below market prices. Agencies are not required to use State Print Services if other options are more cost effective. Contracting the service centers have resulted in savings to customer agencies as well as the gradual elimination of negative retained earnings as seen in the table below. Funding Detail Sources of Finance
(click linked fund name for more info) | 2009
Actual | 2010
Actual | 2011
Actual | 2012
Actual | 2013
Approp | | Dedicated Credits - Intragvt Rev | $3,423,700 | $3,197,500 | $3,226,300 | $3,098,100 | $3,413,400 | | Sale of Fixed Assets | ($12,100) | $6,100 | $10,300 | $30,500 | $0 | | Total | $3,411,600 | $3,203,600 | $3,236,600 | $3,128,600 | $3,413,400 |
|---|
| | | | | | Categories of Expenditure
(mouse-over category name for definition) | 2009
Actual | 2010
Actual | 2011
Actual | 2012
Actual | 2013
Approp |
|---|
| Personnel Services | $218,700 | $239,500 | $225,100 | $247,500 | $261,500 | | In-state Travel | $2,100 | $2,000 | $1,600 | $1,100 | $1,600 | | Out-of-state Travel | $1,300 | $900 | $0 | $0 | $0 | | Current Expense | $1,453,700 | $1,379,600 | $1,355,800 | $1,218,200 | $1,289,400 | | DP Current Expense | $0 | $400 | $3,100 | $4,200 | $3,100 | | Other Charges/Pass Thru | $36,000 | $44,500 | $45,200 | $46,200 | $45,200 | | Depreciation | $1,484,300 | $1,468,600 | $1,483,400 | $1,470,700 | $1,670,500 | | Total | $3,196,100 | $3,135,500 | $3,114,200 | $2,987,900 | $3,271,300 |
|---|
| | | | | | | Other Indicators | 2009
Actual | 2010
Actual | 2011
Actual | 2012
Actual | 2013
Approp |
|---|
| Budgeted FTE | 3.0 | 3.0 | 3.0 | 3.0 | 3.0 | | Actual FTE | 3.0 | 3.3 | 3.0 | 3.2 | 0.0 | | Authorized Capital Outlay | $1,516,800 | $1,048,200 | $1,294,700 | $1,359,400 | $2,935,900 | | Retained Earnings | ($704,200) | ($636,000) | ($513,600) | ($372,700) | ($219,100) |
|
|
|
|
|
|
|---|
Subcommittee Table of ContentsProgram: ISF - State Surplus Property Function The division sells state agency surplus property to the public subject to a 30-day purchase priority that is given to state and local government agencies. The best possible price is obtained by using varied sales methods including: warehouse direct sales, sealed bids, spot bids, auction sales to the public, and internet-based auctions. The rate structure for State Surplus Property allows the program to retain total proceeds from sales in order to fund operating expenses. If the program earns a profit and shows a positive retained earnings balance, State Surplus may proportionately rebate profits to state agencies. In addition to properly disposing of equipment in accordance with environmental law, State Surplus Property provides a consistent accountability structure for the disposal of property. A central system protects the state against fraud and claims of fraud in the disposition of surplus property. Funding Detail Sources of Finance
(click linked fund name for more info) | 2009
Actual | 2010
Actual | 2011
Actual | 2012
Actual | 2013
Approp | | Dedicated Credits - Intragvt Rev | $1,073,200 | $944,800 | $707,200 | $1,028,500 | $707,100 | | Total | $1,073,200 | $944,800 | $707,200 | $1,028,500 | $707,100 |
|---|
| | | | | | Categories of Expenditure
(mouse-over category name for definition) | 2009
Actual | 2010
Actual | 2011
Actual | 2012
Actual | 2013
Approp |
|---|
| Personnel Services | $531,700 | $504,200 | $472,500 | $477,500 | $542,500 | | In-state Travel | $900 | $600 | $1,000 | $900 | $1,200 | | Out-of-state Travel | ($500) | $800 | $0 | $400 | $1,400 | | Current Expense | $210,900 | $227,000 | $196,500 | $188,300 | $199,100 | | DP Current Expense | $70,300 | $72,800 | $50,300 | $57,500 | $80,600 | | Other Charges/Pass Thru | $200,900 | $114,200 | $73,300 | $2,000 | $10,900 | | Depreciation | $32,000 | $33,000 | $34,000 | $34,400 | $50,000 | | Total | $1,046,200 | $952,600 | $827,600 | $761,000 | $885,700 |
|---|
| | | | | | | Other Indicators | 2009
Actual | 2010
Actual | 2011
Actual | 2012
Actual | 2013
Approp |
|---|
| Budgeted FTE | 8.8 | 8.0 | 8.8 | 8.7 | 8.7 | | Actual FTE | 7.8 | 7.9 | 6.1 | 4.6 | 0.0 | | Authorized Capital Outlay | $29,300 | $0 | $11,900 | $0 | $45,000 | | Retained Earnings | $385,500 | $377,700 | $257,300 | $524,900 | ($89,700) | | Vehicles | 6 | 7 | 0 | 7 | 7 |
|
|
|
|
|
|
|---|
Subcommittee Table of ContentsProgram: ISF - Federal Surplus Property Function The Federal Surplus Program acquires and donates federal property to public and non-profit agencies. A handling fee is charged to agencies acquiring surplus property. These dedicated credits fund the operation while offering a means for state, county, and local agencies to purchase equipment at reduced rates. During the 2004 General Session, the Legislature decided to reduce this non-essential program to merely an agent to acquire federal property when requested from state or local entities. Funding Detail Sources of Finance
(click linked fund name for more info) | 2009
Actual | 2010
Actual | 2011
Actual | 2012
Actual | 2013
Approp | | Dedicated Credits - Intragvt Rev | $13,900 | $108,900 | $19,600 | $46,100 | $23,000 | | Total | $13,900 | $108,900 | $19,600 | $46,100 | $23,000 |
|---|
| | | | | | Categories of Expenditure
(mouse-over category name for definition) | 2009
Actual | 2010
Actual | 2011
Actual | 2012
Actual | 2013
Approp |
|---|
| Personnel Services | $6,600 | $8,500 | $5,800 | $7,100 | $6,400 | | Out-of-state Travel | $500 | $500 | $0 | $400 | $600 | | Current Expense | $6,900 | $104,700 | $7,400 | $24,500 | $7,400 | | DP Current Expense | $0 | $0 | $13,000 | $9,800 | $17,000 | | Other Charges/Pass Thru | $0 | $3,300 | $1,900 | $0 | $3,800 | | Depreciation | $0 | $0 | $5,800 | $7,000 | $5,800 | | Total | $14,000 | $117,000 | $33,900 | $48,800 | $41,000 |
|---|
| | | | | | | Other Indicators | 2009
Actual | 2010
Actual | 2011
Actual | 2012
Actual | 2013
Approp |
|---|
| Budgeted FTE | 0.4 | 1.0 | 0.5 | 0.1 | 0.1 | | Actual FTE | 0.1 | 0.1 | 0.2 | 0.1 | 0.0 | | Authorized Capital Outlay | $0 | $0 | $35,000 | $0 | $0 | | Retained Earnings | ($25,700) | ($33,800) | ($48,100) | ($50,800) | ($82,200) |
|
|
|
|
|
|
|---|
Subcommittee Table of Contents |