Agency: Juvenile Justice Services Line Item: Programs and Operations Function The Programs and Operations line item is the sole line item for the Division of Juvenile Justice Services. Prior to FY 2007, the Youth Parole Authority was a separate line item within the division.
Intent Language The Legislature intends that the Division of Juvenile Justice Services report back during the 2013 General Session its progress regarding the following items found in the document titled "Human Services - Follow Up on In-depth Budget Review" affecting the department's Fiscal Year 2013 appropriated budget as reported to the Executive Offices and Criminal Justice Appropriations Subcommittee on February 3, 2012: item numbers 13, 14, and 15 of the Selected Major Recommendations and numbers 1, 6, 7, and 14 of the remaining recommendations. Under Section 63J-1-603 of the Utah Code, the Legislature intends that appropriations up to $1,500,000 provided for the Division of Juvenile Justice Services line item in Item 19 of Chapter 2 Laws of Utah 2011 not lapse at the close of Fiscal Year 2012. The use of any nonlapsing funds is limited to expenditures for data processing and technology based expenditures, facility repairs and maintenance, and other charges and pass through expenditures. Performance With the current performance tracking method used by the Division of Juvenile Justice Services (DJJS), certain performance measures are duplicated across programs within the division. Performance data is aggregated at the agency level with no program specific data available. As a result, the same performance data for DJJS services is reported for multiple programs throughout this compendium of budget information. Funding Detail For more detail about a particular source of finance or organizational unit, click a linked entry in the left column of the table(s) below. Sources of Finance
(click linked fund name for more info) | 2009
Actual | 2010
Actual | 2011
Actual | 2012
Actual | 2013
Approp | | General Fund | $84,891,800 | $78,581,100 | $82,143,100 | $81,669,500 | $82,749,100 | | General Fund, One-time | ($629,300) | $1,663,800 | $7,740,000 | $3,000,000 | $2,000,000 | | Federal Funds | $1,946,700 | $2,006,000 | $2,063,400 | $3,040,200 | $2,894,300 | | American Recovery and Reinvestment Act | $1,489,900 | $1,831,200 | $703,500 | $0 | $0 | | Dedicated Credits Revenue | $2,996,300 | $2,850,800 | $2,334,300 | $2,497,700 | $2,411,300 | | Dedicated Credits - Land Grant | $0 | $0 | $0 | $0 | $1,600 | | Transfers - Child Nutrition | $827,000 | $833,600 | $935,600 | $943,700 | $957,200 | | Transfers - Commission on Criminal and Juvenile Justice | $384,000 | $255,200 | $809,800 | $911,600 | $547,300 | | Transfers - H - Medical Assistance | $0 | $0 | $0 | ($59,800) | $0 | | Transfers - Interagency | $0 | $6,600 | $0 | $0 | $0 | | Transfers - Medicaid | $14,119,200 | $13,134,800 | ($800,200) | ($1,540,900) | ($1,076,600) | | Transfers - Medicaid Admin | $0 | $0 | $0 | ($18,900) | $0 | | Transfers - Other Agencies | $111,500 | $8,000 | ($29,900) | $0 | ($30,900) | | Transfers - Within Agency | $77,800 | $182,700 | ($408,500) | ($431,000) | ($408,500) | | Beginning Nonlapsing | $1,247,900 | $760,500 | $1,500,000 | $2,884,000 | $0 | | Beginning Nonlapsing - Dept of Corrections | $0 | $0 | $0 | $0 | $750,000 | | Closing Nonlapsing | ($760,500) | ($1,500,000) | ($2,884,000) | ($1,398,800) | $0 | | Lapsing Balance | ($359,500) | ($607,900) | $0 | $0 | $0 | | Total | $106,342,800 | $100,006,400 | $94,107,100 | $91,497,300 | $90,794,800 |
|---|
| | | | | | Programs:
(click linked program name to drill-down) | 2009
Actual | 2010
Actual | 2011
Actual | 2012
Actual | 2013
Approp |
|---|
| Administration | $4,160,000 | $3,948,100 | $4,391,200 | $4,241,200 | $4,357,500 | | Early Intervention Services | $12,724,100 | $11,377,600 | $11,325,800 | $11,372,200 | $8,534,300 | | Community Programs | $35,786,800 | $32,940,100 | $27,885,700 | $26,802,100 | $28,116,600 | | Correctional Facilities | $27,772,800 | $27,100,500 | $27,730,300 | $26,974,700 | $27,036,800 | | Rural Programs | $25,544,100 | $24,297,000 | $22,425,300 | $21,764,000 | $22,387,100 | | Youth Parole Authority | $355,000 | $343,100 | $348,800 | $343,100 | $362,500 | | Total | $106,342,800 | $100,006,400 | $94,107,100 | $91,497,300 | $90,794,800 |
|---|
| | | | | | Categories of Expenditure
(mouse-over category name for definition) | 2009
Actual | 2010
Actual | 2011
Actual | 2012
Actual | 2013
Approp |
|---|
| Personnel Services | $54,718,700 | $52,236,200 | $52,445,900 | $51,699,800 | $49,617,500 | | In-state Travel | $152,200 | $92,000 | $112,800 | $161,900 | $162,000 | | Out-of-state Travel | $16,400 | $10,000 | $14,900 | $13,700 | $21,100 | | Current Expense | $17,248,000 | $16,875,800 | $10,652,400 | $10,411,000 | $12,293,000 | | DP Current Expense | $1,004,700 | $988,700 | $1,311,300 | $1,237,600 | $927,400 | | Capital Outlay | $45,400 | $27,200 | $818,600 | $86,100 | $15,000 | | Other Charges/Pass Thru | $33,157,400 | $29,776,500 | $28,751,200 | $27,887,200 | $27,758,800 | | Total | $106,342,800 | $100,006,400 | $94,107,100 | $91,497,300 | $90,794,800 |
|---|
| | | | | | | Other Indicators | 2009
Actual | 2010
Actual | 2011
Actual | 2012
Actual | 2013
Approp |
|---|
| Budgeted FTE | 988.0 | 958.8 | 906.8 | 953.5 | 948.4 | | Actual FTE | 962.3 | 919.0 | 910.9 | 916.4 | 0.0 | | Vehicles | 145 | 145 | 143 | 145 | 145 |
|
|
|
|
|
|
|---|
Subcommittee Table of ContentsProgram: Administration Function DJJS Administration is responsible for administration of all mandated duties, division policy development, centralized fiscal services and budgetary development, program planning and evaluation, research, training, and quality assurance. DJJS Administration is also accountable for oversight and quality control of the division's activities. Program offices direct the day-to-day operations of the division (UCA 62A-7-104(2)). In addition to administrative responsibilities, the DJJS director represents the division in a variety of settings including: division director within the Department of Human Services; member of the Utah Commission on Criminal and Juvenile Justice; member of the Sentencing Commission; member of the Substance Abuse and Anti-Violence Coordinating Council; and chair of the Commission on Criminal and Juvenile Justice - Juvenile Justice Committee. DJJS Administration is organized into five bureaus: Research and Evaluation. Promotes ongoing research, evaluation, and monitoring of division programs to determine their effectiveness in providing services to delinquent youth.
Investigations. Investigates non-routine, unusual, or potentially threatening events related to clients in division and contracted programs.
Training. Emphasizes professionalism and maintains the latest, most effective treatment methods focusing on the proper care of youth in division programs; it also coordinates the volunteer efforts throughout the division.
Clinical. Coordinates the treatment of youth in secure care.
Administrative Services. Controls and monitors administrative functions in the division, including accounting, budgeting, grants, contracts, technology, reporting, and compliance. Statutory Authority UCA 62A-7-104 (1 through 12) provides statutory guidelines for the administration of Juvenile Justice Services. UCA 62A-7-103 establishes the division director's position as well as outlines the qualifications and the responsibilities of the job. Performance Percentage of employees completing training, quality assurance reviews completed, and volunteer hours are the top three measures submitted by the administration as indicators of success.
Percentage of Employees Completing Hours of Training
FY2010: 95.0%, 719 out of 757 employees
FY2011: 96.2%, 719 out of 784 employees
FY2012: Not Readily Available
Quality Assurance Reviews Completed
Volunteer Hours
Funding Detail Sources of Finance
(click linked fund name for more info) | 2009
Actual | 2010
Actual | 2011
Actual | 2012
Actual | 2013
Approp | | General Fund | $4,757,900 | $3,522,300 | $4,184,000 | $3,919,400 | $4,086,700 | | General Fund, One-time | ($931,800) | ($412,600) | $0 | $0 | $0 | | Federal Funds | $114,700 | $147,900 | $182,200 | $146,600 | $182,400 | | American Recovery and Reinvestment Act | $60,200 | $59,900 | $0 | $0 | $0 | | Dedicated Credits Revenue | $0 | ($100) | $0 | $0 | $100 | | Transfers - Child Nutrition | $0 | $0 | ($1,900) | ($800) | ($2,100) | | Transfers - Commission on Criminal and Juvenile Justice | $0 | $106,900 | $106,000 | $205,100 | $115,400 | | Transfers - Interagency | $0 | $400 | $0 | $0 | $0 | | Transfers - Within Agency | $130,500 | ($3,000) | $0 | $0 | ($25,000) | | Beginning Nonlapsing | $79,000 | $726,700 | $2,600 | $0 | $0 | | Closing Nonlapsing | ($50,500) | ($200,300) | ($81,700) | ($29,100) | $0 | | Total | $4,160,000 | $3,948,100 | $4,391,200 | $4,241,200 | $4,357,500 |
|---|
| | | | | | Categories of Expenditure
(mouse-over category name for definition) | 2009
Actual | 2010
Actual | 2011
Actual | 2012
Actual | 2013
Approp |
|---|
| Personnel Services | $3,465,700 | $3,329,600 | $3,306,400 | $3,291,200 | $3,505,800 | | In-state Travel | $11,700 | $8,500 | $10,700 | $10,900 | $16,900 | | Out-of-state Travel | $4,900 | $3,800 | $4,900 | $4,900 | $13,000 | | Current Expense | $437,600 | $362,600 | $454,500 | $585,100 | $422,200 | | DP Current Expense | $92,300 | $71,000 | $145,100 | $128,300 | $77,400 | | Capital Outlay | $0 | $0 | $0 | $11,100 | $0 | | Other Charges/Pass Thru | $147,800 | $172,600 | $469,600 | $209,700 | $322,200 | | Total | $4,160,000 | $3,948,100 | $4,391,200 | $4,241,200 | $4,357,500 |
|---|
| | | | | | | Other Indicators | 2009
Actual | 2010
Actual | 2011
Actual | 2012
Actual | 2013
Approp |
|---|
| Budgeted FTE | 48.0 | 43.1 | 43.1 | 44.0 | 44.0 | | Actual FTE | 43.5 | 41.5 | 40.7 | 40.5 | 0.0 | | Vehicles | 3 | 3 | 3 | 3 | 3 |
|
|
|
|
|
|
|---|
Subcommittee Table of ContentsProgram: Early Intervention Services Function The Early Intervention Services Program provides, through direct operation or contractual agreements, preemptive, front-end services to youth, their families, and the community in a geographic area covered by the Second, Third, and Fourth Juvenile Court districts. The program manages: Receiving Centers. Non-residential facilities where law enforcement officers can take youth who have been arrested but do not meet the admission guidelines for secure detention. The staff locates parents or guardians which frees law enforcement to return to normal duties. Staff members assess the youth to determine if other interventions may be of benefit, and notify parents of resources available in the community.
Home Detention. Provides an alternative to secure detention for youth awaiting adjudication or placement. Youth are home in the community with daily supervision provided by qualified staff.
Youth Services. Provides 24-hour crisis counseling services to runaway and ungovernable youth and their families. Services attempt to keep families intact and commit resources, but short of a full intervention into the Juvenile Justice System. Services also include short-term crisis beds.
Diversion Services. Short-term (30 day) treatment services to non-DJJS custodial youth referred by the Juvenile Court. Programming includes intensive daily supervision, competency development, and community service/restitution.
Genesis Youth Center. This work program provides the opportunity for youth offenders to provide restitution to victims. Services help to maintain and operate public agencies and non-profit programs. The center also provides education and prevocational programs. Observation and Assessment Centers. This 45-day program allows the division to prepare a comprehensive evaluation and treatment plane for custody youth. Resulting recommendations to the Juvenile Court facilitate future treatments and placements. Psychological, behavioral, social, educational, and physical assessments, evaluations, and observations are utilized. Statutory Authority - UCA 62A-7-104 establishes statutory authority for early intervention programs.
- UCA 62A-7-601 details prevention and early intervention program standards
- UCA 62A-7-601(1) directs the establishment and operation of youth services programs.
- UCA 62A-7-601(5) directs the establishment and administration of receiving centers.
Intent Language Performance The program has identified the top performance measures it uses to monitor success in each of its focus areas. Greater detail is provided for each focus area below. Generally, each performance measure includes data for three years, beginning in FY 2010. Where only one or two years is represented, no data was submitted for that year. The Division of Juvenile Justice Services provided an explanation for each measure. Diversion Services
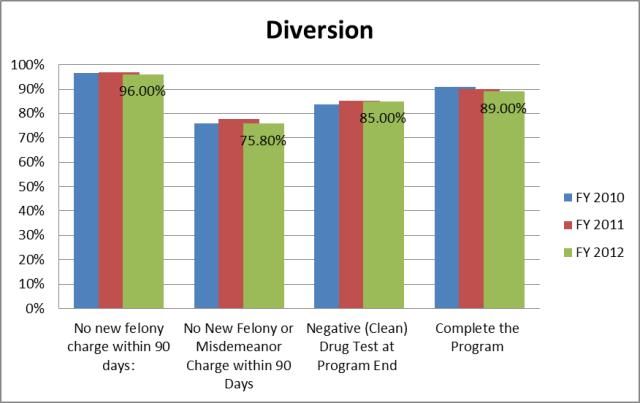
Four performance measures have been identified for Diversion, they are:
- Percent of those completing the program with no new felony charge within 90 days
The measure identifies youth recidivism after program completion. This measures the program's ability to suppress youths further penetration into the juvenile justice system and to keep the community safe from more serious offenses.
- Percent of Those Completing the Program with No New Felony or Misdemeanor Charge within 90 Days
The measure identifies youth recidivism after program completion. This measures the program's ability to suppress youths further penetration into the juvenile justice system and to keep the community safe from any type of offense.
- Percent of Youth with a Negative (Clean) Drug Test at Program End
The measure identifies the program's ability to suppress youths delinquency and avoid further penetration into the juvenile justice system.
- Percent of Youth Who Complete the Program.
This measures the program's ability to successfully divert youth from more restrictive and costly detention facilities.
 Receiving Centers
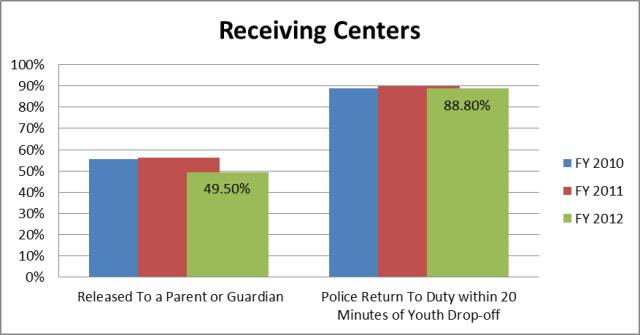
Two performance measures have been identified:
- Percent of Youth Released To a Parent or Guardian
Receiving centers strive to reunite youth with their parents or adult guardians and to aid the family in obtaining community resources available to address offending issues. The measure identifies the program's ability to successfully do this.
- Percent of Police Who Bring Youth to the Center Who Return To Duty within 20 Minutes
Local law enforcement officers place status offending youth in receiving centers, thus allowing the officers to quickly return to their duties in the community. This measure identifies how successful the program meets the local law enforcement officers need to return to their regular duties.
 Genesis Work Program
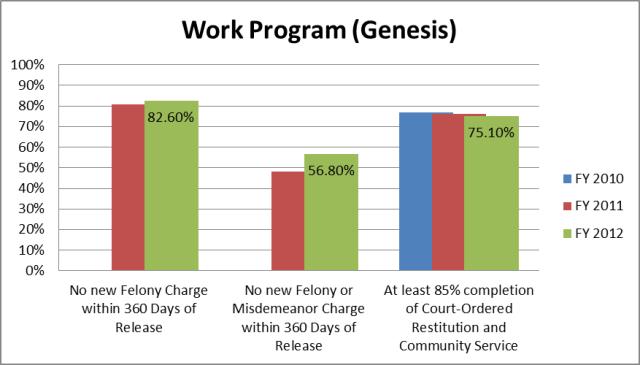
Three performance measures have been identified for the Genesis Work program:
- Percent of Youth without a New Felony Charge within 360 Days of Release
The measure identifies youth recidivism after program completion. This measures the program's ability to suppress youths further penetration into the juvenile justice system and to keep the community safe from more serious offenses.
- Percent of Youth without a New Felony or Misdemeanor Charge within 360 Days of Release
The measure identifies youth recidivism after program completion. This measures the program's ability to suppress youths further penetration into the juvenile justice system and to keep the community safe from any type of offense.
- Percent of Youth Who Complete At Least 85% of Their Court-Ordered Restitution and Community Service While In the Program
The Genesis program provides a vehicle for youth to meet their court-ordered obligations. This measures the program's ability to have youth complete those obligations.
 Observation and Assessment [O&A]
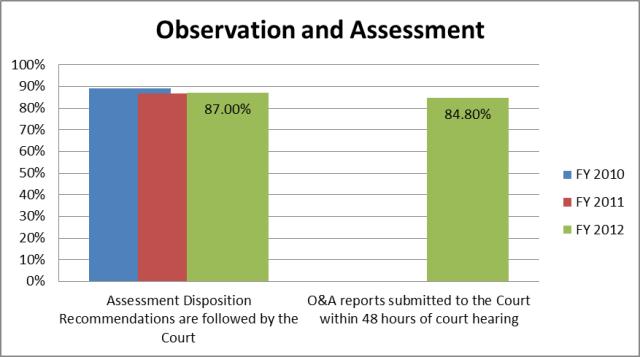
Two performance measures have been identified:
- Percent of Youth Where the Assessment Disposition Recommendations are followed by the Court
After assessments are completed, the staff use the gathered information to make recommendations to the courts as to the best placement for the youths. This measures the staffs ability to make appropriate recommendations and to articulate those effectively to the courts.
- Percent of O&A reports submitted to the Court within 48 hours of the court hearing
This measures the staff's responsiveness to submit information to the courts for their proceedings.
 Funding Detail Sources of Finance
(click linked fund name for more info) | 2009
Actual | 2010
Actual | 2011
Actual | 2012
Actual | 2013
Approp | | General Fund | $12,051,600 | $11,016,500 | $11,010,200 | $10,962,100 | $6,803,900 | | General Fund, One-time | $242,500 | $116,700 | $0 | $0 | $1,250,000 | | Federal Funds | $321,000 | $323,100 | $205,000 | $229,100 | $274,600 | | American Recovery and Reinvestment Act | $0 | $500 | $5,100 | $0 | $0 | | Dedicated Credits Revenue | $19,800 | $20,000 | $114,200 | $124,200 | $116,100 | | Transfers - Child Nutrition | $0 | $77,500 | $97,000 | $88,000 | $89,700 | | Transfers - Other Agencies | $81,300 | $0 | $0 | $0 | $0 | | Beginning Nonlapsing | $150,000 | $33,800 | $78,600 | $0 | $0 | | Closing Nonlapsing | ($142,100) | ($210,500) | ($184,300) | ($31,200) | $0 | | Total | $12,724,100 | $11,377,600 | $11,325,800 | $11,372,200 | $8,534,300 |
|---|
| | | | | | Categories of Expenditure
(mouse-over category name for definition) | 2009
Actual | 2010
Actual | 2011
Actual | 2012
Actual | 2013
Approp |
|---|
| Personnel Services | $8,674,300 | $8,214,200 | $8,204,200 | $8,132,600 | $5,321,600 | | In-state Travel | $1,800 | $100 | $0 | $1,200 | $0 | | Current Expense | $1,497,400 | $1,498,300 | $1,592,800 | $1,752,500 | $2,494,600 | | DP Current Expense | $170,500 | $179,300 | $209,500 | $202,300 | $124,700 | | Capital Outlay | $0 | $0 | $18,800 | $5,900 | $5,000 | | Other Charges/Pass Thru | $2,380,100 | $1,485,700 | $1,300,500 | $1,277,700 | $588,400 | | Total | $12,724,100 | $11,377,600 | $11,325,800 | $11,372,200 | $8,534,300 |
|---|
| | | | | | | Other Indicators | 2009
Actual | 2010
Actual | 2011
Actual | 2012
Actual | 2013
Approp |
|---|
| Budgeted FTE | 157.0 | 143.5 | 117.4 | 142.0 | 142.0 | | Actual FTE | 149.2 | 141.5 | 138.4 | 139.7 | 0.0 | | Vehicles | 45 | 45 | 44 | 54 | 45 |
|
|
|
|
|
|
|---|
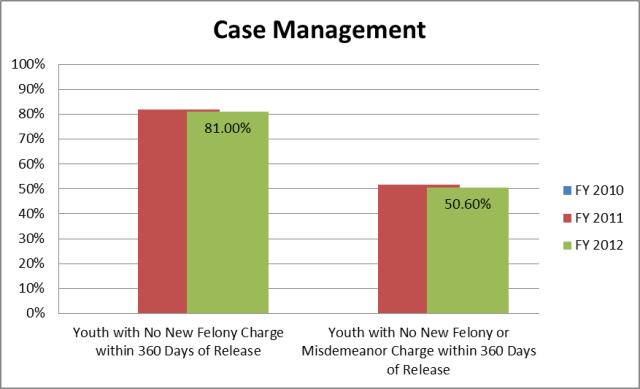
Subcommittee Table of ContentsProgram: Community Programs Function The Community Program area provides a wide variety of services to youth, their families, and the community along the Wasatch Front. Most clients are from the Second, Third, and Fourth Juvenile Court districts. Services include case management, community-based programs, and aftercare/transition programs. All programs have been or are being developed around the Balanced and Restorative Justice Model. Statutory Authority Statutory authority for Community Programs is UCA 62A-7-104 and UCA 62A-7-701. These sections provide the general operating and procedural guidelines. Performance The program has identified the top performance measures it uses to monitor success in each of its focus areas. Greater detail is provided for each focus area below. Generally, each performance measure includes data for three years, beginning in FY 2010. Where only one or two years is represented, no data was submitted for that year. The Division of Juvenile Justice Services provided an explanation for each measure. Case Management
Two performance measures have been identified:
- Percent of Youth Leaving the Program without a New Felony Charge within 360 Days of Release
The measure identifies youth recidivism after program completion. This measures the program's ability to suppress youths further penetration into the juvenile justice system and to keep the community safe from more serious offenses.
- Percent of Youth Leaving the Program without a New Felony or Misdemeanor Charge within 360 Days of Release
The measure identifies youth recidivism after program completion. This measures the program's ability to suppress youths further penetration into the juvenile justice system and to keep the community safe from any type of offense.
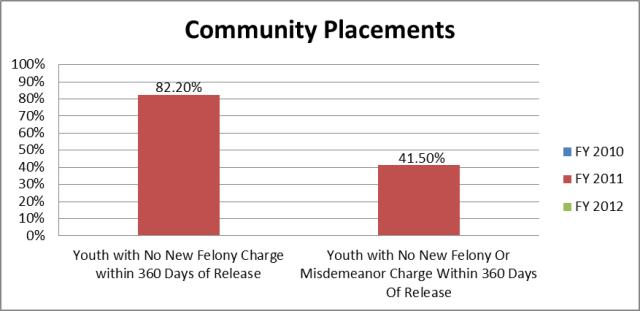
 Community Placements
Two performance measures have been identified:
- Percent of Youth without a New Felony Charge within 360 Days of Release
The measure identifies youth recidivism after program completion. This measures the program's ability to suppress youths further penetration into the juvenile justice system and to keep the community safe from more serious offenses.
- Percent Of Youth Without A New Felony Or Misdemeanor Charge Within 360 Days Of Release
The measure identifies youth recidivism after program completion. This measures the program's ability to suppress youths further penetration into the juvenile justice system and to keep the community safe from any type of offense.
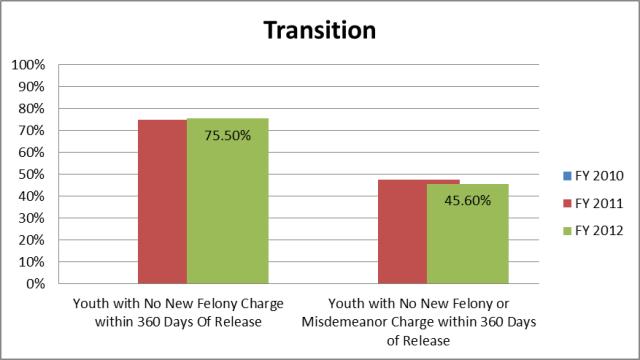
 Transition
Two performance measures have been identified:
- Percent of Youth without a New Felony Charge within 360 Days of Release
The measure identifies youth recidivism after program completion. This measures the program's ability to suppress youths further penetration into the juvenile justice system and to keep the community safe from more serious offenses.
- Percent Of Youth Without A New Felony Or Misdemeanor Charge Within 360 Days Of Release
The measure identifies youth recidivism after program completion. This measures the program's ability to suppress youths further penetration into the juvenile justice system and to keep the community safe from any type of offense.
 Funding Detail In FY 2011, the major source of funding for Community Programs (CP) was the General Fund, making up 91% of CP revenues. CP receives federal funds from the Title XX Social Services Block Grant and foster care (7%). Other sources of funding include dedicated credits revenue from recovery services collections (2%). Sources of Finance
(click linked fund name for more info) | 2009
Actual | 2010
Actual | 2011
Actual | 2012
Actual | 2013
Approp | | General Fund | $21,348,900 | $20,596,000 | $19,633,500 | $20,924,200 | $24,572,700 | | General Fund, One-time | ($617,000) | ($1,724,200) | $5,802,400 | $1,480,000 | $750,000 | | Federal Funds | $1,302,900 | $1,330,400 | $1,334,500 | $2,199,600 | $1,971,300 | | American Recovery and Reinvestment Act | $1,086,600 | $1,345,900 | $625,900 | $0 | $0 | | Dedicated Credits Revenue | $1,779,100 | $1,556,700 | $1,216,100 | $1,178,300 | $1,276,300 | | Transfers - Child Nutrition | $78,200 | $73,700 | $83,500 | $82,900 | $86,000 | | Transfers - Commission on Criminal and Juvenile Justice | $212,300 | $71,600 | $651,400 | $622,000 | $348,100 | | Transfers - H - Medical Assistance | $0 | $0 | $0 | ($59,800) | $0 | | Transfers - Medicaid | $10,733,600 | $10,009,500 | ($617,000) | ($1,144,900) | ($827,100) | | Transfers - Other Agencies | $0 | $0 | ($23,500) | $0 | ($23,500) | | Transfers - Within Agency | ($54,400) | $157,400 | ($118,700) | ($224,600) | ($37,200) | | Beginning Nonlapsing | $188,400 | $0 | $126,800 | $2,164,000 | $0 | | Closing Nonlapsing | ($49,100) | ($248,800) | ($829,200) | ($419,600) | $0 | | Lapsing Balance | ($222,700) | ($228,100) | $0 | $0 | $0 | | Total | $35,786,800 | $32,940,100 | $27,885,700 | $26,802,100 | $28,116,600 |
|---|
| | | | | | Categories of Expenditure
(mouse-over category name for definition) | 2009
Actual | 2010
Actual | 2011
Actual | 2012
Actual | 2013
Approp |
|---|
| Personnel Services | $10,254,700 | $9,500,500 | $9,817,300 | $9,440,800 | $9,741,100 | | In-state Travel | $44,600 | $22,700 | $23,000 | $33,100 | $23,000 | | Out-of-state Travel | $10,200 | $4,700 | $7,100 | $6,700 | $7,100 | | Current Expense | $1,940,100 | $1,755,500 | $1,650,000 | $1,677,100 | $2,382,600 | | DP Current Expense | $241,000 | $243,900 | $325,900 | $251,900 | $237,700 | | Capital Outlay | $0 | $5,700 | $6,300 | $27,500 | $0 | | Other Charges/Pass Thru | $23,296,200 | $21,407,100 | $16,056,100 | $15,365,000 | $15,725,100 | | Total | $35,786,800 | $32,940,100 | $27,885,700 | $26,802,100 | $28,116,600 |
|---|
| | | | | | | Other Indicators | 2009
Actual | 2010
Actual | 2011
Actual | 2012
Actual | 2013
Approp |
|---|
| Budgeted FTE | 162.0 | 166.6 | 166.6 | 165.4 | 160.3 | | Actual FTE | 168.2 | 155.0 | 158.5 | 156.1 | 0.0 | | Vehicles | 38 | 38 | 37 | 30 | 38 |
|
|
|
|
|
|
|---|
Subcommittee Table of ContentsProgram: Correctional Facilities Function Correctional Facilities provides a variety of facilities and programs that include a level of institutional or restricted living. These include: Secure Care. Provide services for serious and repeat offenders including education, vocation, psycho-education services as well as medical care. All services are conducted within secure facilities under the supervision of DJJS staff or contracted providers.
Detention Facilities. Provide temporary care for youth under age 18 awaiting court proceedings and/or placement. A judge can commit youth to detention services for a maximum of 30 days. While in detention, youth are provided with health care as well as education and recreation programming. Statutory Authority The general principles and authority for this program are scattered throughout UCA 62A-7. Specific sections are noted below:
UCA 62A-7-104 directs the division to operate and maintain secure facilities and programs; and
UCA 62A-7-201 through 203 and 401.5 specifically address the issues of confinement, secure facilities, detention facilities, and restrictions. Intent Language The Legislature intends that funds be used for the operation of youth receiving centers in Blanding and Cedar City for FY 2013. Performance The program has identified the top performance measures it uses to monitor success in each of its focus areas. Greater detail is provided for each focus area below. Generally, each performance measure includes data for three years, beginning in FY 2010. Where only one or two years is represented, no data was submitted for that year. The Division of Juvenile Justice Services provided an explanation for each measure. Detention
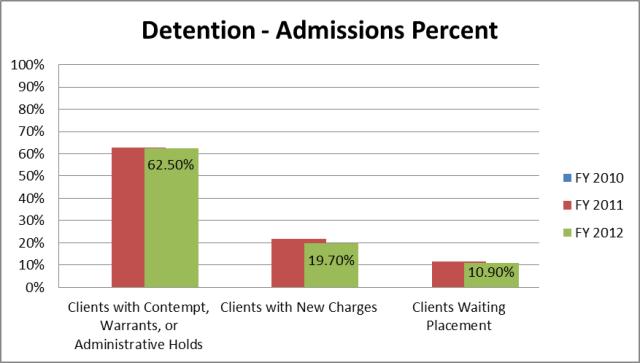
Three performance measures have been identified:
The percentage mix of these three categories of admissions helps identify what types of clients are coming into detention facilities and the resources needed to address the needs of those youth. Clients awaiting placement have generally a short length of stay (just a few days). Clients with new charges, depending on the charges, could indicate longer detention stays with additional resources required. Those admissions for contempt, warrants, or administrative holds are an indication of longer stays up to 30 days, with more long term resources needed to address those client needs in the detention facilities.
- Admissions Percent - Clients with Contempt, Warrants or Administrative Holds
- Admissions Percent - Clients with New Charges
- Admissions Percent - Clients Waiting Placement
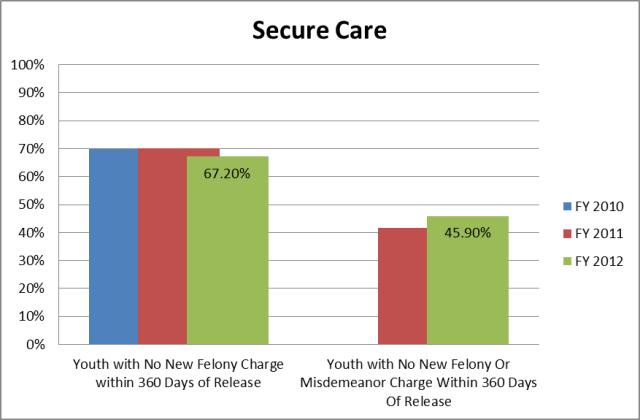
 Secure Care
Two performance measures have been identified:
- Percent of Youth without a New Felony Charge within 360 Days of Release
The measure identifies youth recidivism after program completion. This measures the program's ability to suppress youths further penetration into the juvenile justice system and to keep the community safe from more serious offenses.
- Percent Of Youth Without A New Felony Or Misdemeanor Charge Within 360 Days Of Release
The measure identifies youth recidivism after program completion. This measures the program's ability to suppress youths further penetration into the juvenile justice system and to keep the community safe from any type of offense.
 Funding Detail During the 2012 General Session, the Legislature appropriated $750,000 in nonlapsing balances from the Department of Corrections to DJJS. This is a one-time appropriation for FY 2013 to fund receiving centers in Blanding and Cedar City. Intent language accompanied the appropriation and is included above. Sources of Finance
(click linked fund name for more info) | 2009
Actual | 2010
Actual | 2011
Actual | 2012
Actual | 2013
Approp | | General Fund | $25,566,800 | $26,581,300 | $26,751,200 | $26,217,500 | $25,175,400 | | General Fund, One-time | $677,000 | ($140,600) | $0 | $0 | $0 | | Federal Funds | $33,200 | $16,400 | $12,300 | $1,800 | $41,600 | | Dedicated Credits Revenue | $534,000 | $530,800 | $463,400 | $678,000 | $459,400 | | Dedicated Credits - Land Grant | $0 | $0 | $0 | $0 | $1,600 | | Transfers - Child Nutrition | $572,300 | $513,800 | $590,200 | $605,300 | $608,800 | | Transfers - Commission on Criminal and Juvenile Justice | $48,400 | $0 | $0 | $0 | $0 | | Transfers - Other Agencies | $11,400 | $8,000 | $1,000 | $0 | $0 | | Beginning Nonlapsing | $690,800 | $0 | $922,900 | $0 | $0 | | Beginning Nonlapsing - Dept of Corrections | $0 | $0 | $0 | $0 | $750,000 | | Closing Nonlapsing | ($361,100) | ($409,200) | ($1,010,700) | ($527,900) | $0 | | Total | $27,772,800 | $27,100,500 | $27,730,300 | $26,974,700 | $27,036,800 |
|---|
| | | | | | Categories of Expenditure
(mouse-over category name for definition) | 2009
Actual | 2010
Actual | 2011
Actual | 2012
Actual | 2013
Approp |
|---|
| Personnel Services | $16,070,000 | $15,582,900 | $15,517,400 | $15,335,000 | $14,832,900 | | In-state Travel | $11,400 | $3,800 | $6,200 | $8,800 | $14,500 | | Out-of-state Travel | ($600) | $0 | $2,000 | $800 | $0 | | Current Expense | $11,285,500 | $11,277,500 | $4,878,100 | $4,618,700 | $5,241,400 | | DP Current Expense | $202,900 | $210,500 | $263,800 | $297,000 | $228,900 | | Capital Outlay | $26,900 | $14,900 | $543,300 | $13,400 | $0 | | Other Charges/Pass Thru | $176,700 | $10,900 | $6,519,500 | $6,701,000 | $6,719,100 | | Total | $27,772,800 | $27,100,500 | $27,730,300 | $26,974,700 | $27,036,800 |
|---|
| | | | | | | Other Indicators | 2009
Actual | 2010
Actual | 2011
Actual | 2012
Actual | 2013
Approp |
|---|
| Budgeted FTE | 305.0 | 298.5 | 273.3 | 297.0 | 297.0 | | Actual FTE | 295.6 | 286.7 | 282.6 | 286.0 | 0.0 | | Vehicles | 21 | 21 | 21 | 20 | 21 |
|
|
|
|
|
|
|---|
Subcommittee Table of ContentsProgram: Rural Programs Function Rural Programs includes short-term detention services, secure care, case management, state supervision, observation and assessment services, community-based alternatives, home detention, work programs, shelters, receiving centers, and early intervention services all designed to meet the needs of youth offenders in rural areas of the state. Statutory Authority This program operates under authority derived from sections found at UCA 62A-7. The program provides a combination of services found in each of the other DJJS programs but specifically focuses on rural parts of the state. Performance The top three measures used to determine succes in Rural Programs are provided below. Generally, each performance measure includes data for three years, beginning in FY 2010. Where only one or two years is represented, no data was submitted for that year. The Division of Juvenile Justice Services provided an explanation for each measure. Receiving Centers
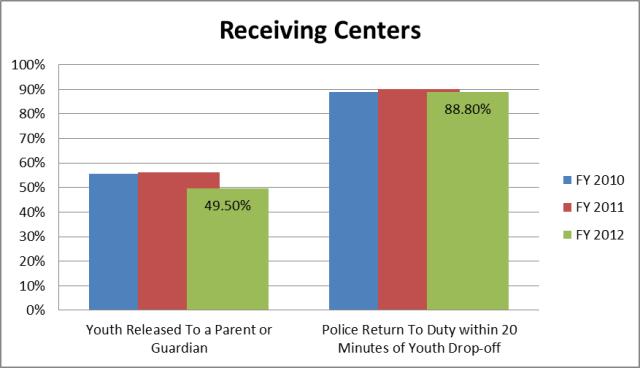
Two performance measures have been identified:
- Percent of Youth Released To a Parent or Guardian
Receiving centers strive to reunite youth with their parents or adult guardians and to aid the family in obtaining community resources available to address offending issues. The measure identifies the program's ability to successfully do this.
- Percent of Police Who Bring Youth to the Center Who Return To Duty within 20 Minutes
Local law enforcement officers place status offending youth in receiving centers, thus allowing the officers to quickly return to their duties in the community. This measure identifies how successful the program meets the local law enforcement officers need to return to their regular duties.
 Observation and Assessment [O&A]
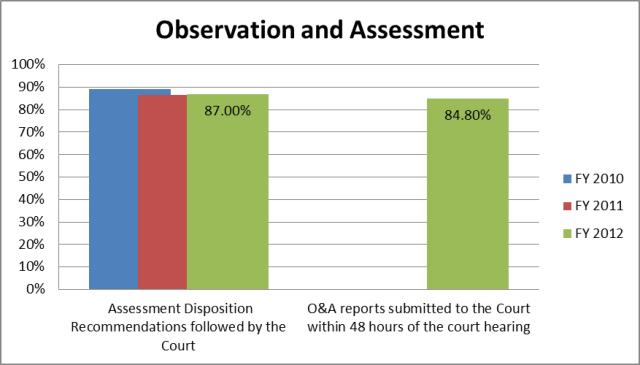
Two performance measures have been identified:
- Percent of Youth Where the Assessment Disposition Recommendations are followed by the Court
After assessments are completed, the staff use the gathered information to make recommendations to the courts as to the best placement for the youths. This measures the staffs ability to make appropriate recommendations and to articulate those effectively to the courts.
- Percent of O&A reports submitted to the Court within 48 hours of the court hearing
This measures the staffs' responsiveness to submit information to the courts for their proceedings.
 Case Management
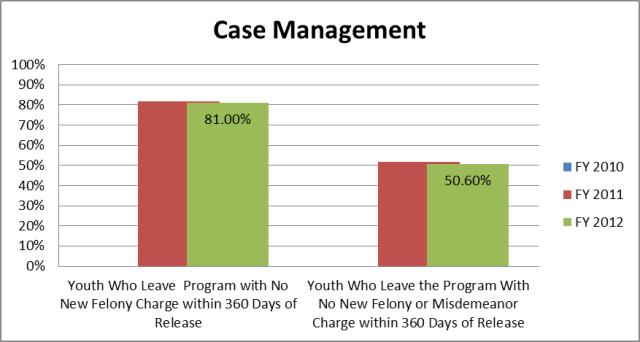
Two performance measures have been identified:
- Percent of Youth Leaving the Program without a New Felony Charge within 360 Days of Release
The measure identifies youth recidivism after program completion. This measures the program's ability to suppress youths further penetration into the juvenile justice system and to keep the community safe from more serious offenses.
- Percent of Youth Leaving the Program without a New Felony or Misdemeanor Charge within 360 Days of Release
The measure identifies youth recidivism after program completion. This measures the program's ability to suppress youths further penetration into the juvenile justice system and to keep the community safe from any type of offenses.
 Detention
Three performance measures have been identified:
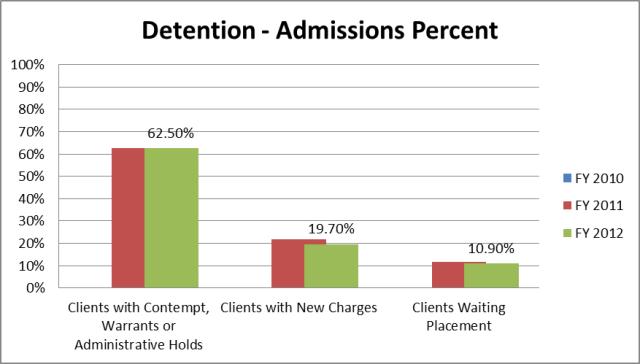
The percentage mix of these three categories of admissions helps identify what types of clients are coming into detention facilities and the resources needed to address the needs of those youth. Clients awaiting placement have generally a short length of stay (just a few days). Clients with new charges, depending on the charges, could indicate longer detention stays with additional resources required. Those admissions for contempt, warrants, or administrative holds are an indication of longer stays up to 30 days, with more long term resources needed to address those client needs in the detention facilities.
- Admissions Percent - Clients with Contempt, Warrants or Administrative Holds
- Admissions Percent - Clients with New Charges
- Admissions Percent - Clients Waiting Placement
 Secure Care
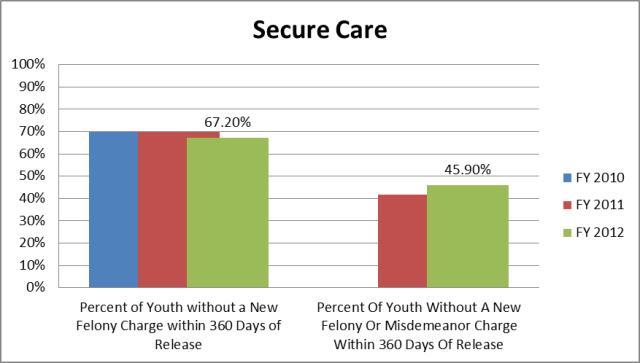
Two performance measures have been identified:
- Percent of Youth without a New Felony Charge within 360 Days of Release
The measure identifies youth recidivism after program completion. This measures the program's ability to suppress youths further penetration into the juvenile justice system and to keep the community safe from more serious offenses.
- Percent Of Youth Without A New Felony Or Misdemeanor Charge Within 360 Days Of Release
The measure identifies youth recidivism after program completion. This measures the program's ability to suppress youths further penetration into the juvenile justice system and to keep the community safe from any type of offense.
 Funding Detail Sources of Finance
(click linked fund name for more info) | 2009
Actual | 2010
Actual | 2011
Actual | 2012
Actual | 2013
Approp | | General Fund | $20,823,400 | $16,526,000 | $20,211,300 | $19,302,900 | $21,763,200 | | General Fund, One-time | $0 | $3,827,300 | $1,937,600 | $1,520,000 | $0 | | Federal Funds | $158,100 | $167,800 | $314,200 | $445,400 | $409,100 | | American Recovery and Reinvestment Act | $343,100 | $424,800 | $72,500 | $0 | $0 | | Dedicated Credits Revenue | $663,400 | $743,400 | $540,600 | $517,200 | $559,400 | | Transfers - Child Nutrition | $176,500 | $168,600 | $166,800 | $168,300 | $174,800 | | Transfers - Commission on Criminal and Juvenile Justice | $123,300 | $76,700 | $52,400 | $84,500 | $83,800 | | Transfers - Interagency | $0 | $6,200 | $0 | $0 | $0 | | Transfers - Medicaid | $3,385,600 | $3,125,300 | ($183,200) | ($396,000) | ($249,500) | | Transfers - Medicaid Admin | $0 | $0 | $0 | ($18,900) | $0 | | Transfers - Other Agencies | $18,800 | $0 | ($7,400) | $0 | ($7,400) | | Transfers - Within Agency | $1,700 | $28,300 | ($289,800) | ($206,400) | ($346,300) | | Beginning Nonlapsing | $139,700 | $0 | $367,800 | $720,000 | $0 | | Closing Nonlapsing | ($152,700) | ($417,600) | ($757,500) | ($373,000) | $0 | | Lapsing Balance | ($136,800) | ($379,800) | $0 | $0 | $0 | | Total | $25,544,100 | $24,297,000 | $22,425,300 | $21,764,000 | $22,387,100 |
|---|
| | | | | | Categories of Expenditure
(mouse-over category name for definition) | 2009
Actual | 2010
Actual | 2011
Actual | 2012
Actual | 2013
Approp |
|---|
| Personnel Services | $15,929,800 | $15,293,600 | $15,277,800 | $15,181,900 | $15,886,900 | | In-state Travel | $70,400 | $48,600 | $66,500 | $101,200 | $96,900 | | Out-of-state Travel | $1,900 | $1,500 | $900 | $1,300 | $1,000 | | Current Expense | $2,076,400 | $1,970,700 | $2,066,100 | $1,766,300 | $1,736,600 | | DP Current Expense | $290,500 | $275,800 | $358,300 | $351,300 | $251,700 | | Capital Outlay | $18,500 | $6,600 | $250,200 | $28,200 | $10,000 | | Other Charges/Pass Thru | $7,156,600 | $6,700,200 | $4,405,500 | $4,333,800 | $4,404,000 | | Total | $25,544,100 | $24,297,000 | $22,425,300 | $21,764,000 | $22,387,100 |
|---|
| | | | | | | Other Indicators | 2009
Actual | 2010
Actual | 2011
Actual | 2012
Actual | 2013
Approp |
|---|
| Budgeted FTE | 312.0 | 303.1 | 302.4 | 301.1 | 301.1 | | Actual FTE | 301.8 | 290.6 | 286.7 | 290.1 | 0.0 | | Vehicles | 38 | 38 | 38 | 38 | 38 |
|
|
|
|
|
|
|---|
Subcommittee Table of ContentsProgram: Youth Parole Authority Function The Youth Parole Authority is responsible for parole release, rescission, revocation, and termination for youth offenders who have been committed to the division for secure confinement. The Youth Parole Authority determines when and under what conditions committed youth offenders are eligible for parole. The Parole Authority is a citizen board appointed by the Governor and acts independently of DJJS. Background In FY 2007, the Youth Parole Authority became a program in the DJJS Programs and Operations line item. Statutory Authority The governing statute of the Youth Parole Authority is within the division's section of Utah Code 62A-7. - UCA 62A-7-501 creates the Youth Parole Authority and establishes the authorized membership, expenses, responsibilities, and procedures; and
- UCA 62A-7-502 through 507 establishes parole procedures.
Performance Youth Parole Authority Client Hearings (Calendar Year)
Funding Detail In FY 2007, the Legislature combined the Youth Parole Authority line item with the DJJS Programs and Operations line item. The following table depicts the funding history for the Youth Parole Authority within the Programs and Operations line item. Sources of Finance
(click linked fund name for more info) | 2009
Actual | 2010
Actual | 2011
Actual | 2012
Actual | 2013
Approp | | General Fund | $343,200 | $339,000 | $352,900 | $343,400 | $347,200 | | General Fund, One-time | $0 | ($2,800) | $0 | $0 | $0 | | Federal Funds | $16,800 | $20,400 | $15,200 | $17,700 | $15,300 | | American Recovery and Reinvestment Act | $0 | $100 | $0 | $0 | $0 | | Beginning Nonlapsing | $0 | $0 | $1,300 | $0 | $0 | | Closing Nonlapsing | ($5,000) | ($13,600) | ($20,600) | ($18,000) | $0 | | Total | $355,000 | $343,100 | $348,800 | $343,100 | $362,500 |
|---|
| | | | | | Categories of Expenditure
(mouse-over category name for definition) | 2009
Actual | 2010
Actual | 2011
Actual | 2012
Actual | 2013
Approp |
|---|
| Personnel Services | $324,200 | $315,400 | $322,800 | $318,300 | $329,200 | | In-state Travel | $12,300 | $8,300 | $6,400 | $6,700 | $10,700 | | Current Expense | $11,000 | $11,200 | $10,900 | $11,300 | $15,600 | | DP Current Expense | $7,500 | $8,200 | $8,700 | $6,800 | $7,000 | | Total | $355,000 | $343,100 | $348,800 | $343,100 | $362,500 |
|---|
| | | | | | | Other Indicators | 2009
Actual | 2010
Actual | 2011
Actual | 2012
Actual | 2013
Approp |
|---|
| Budgeted FTE | 4.0 | 4.0 | 4.0 | 4.0 | 4.0 | | Actual FTE | 4.0 | 3.9 | 4.0 | 4.0 | 0.0 |
|
|
|
|
|
|
|---|
Subcommittee Table of Contents |


