Agency: Utah State University Line Item: Cooperative Extension Function USU's Cooperative Extension delivers research-based education and information throughout the State in cooperation with federal, state, and county partnerships. Almost every county in the State has a Cooperative Extension Office, which links rural and underserved areas of the State with USU.
Statutory Authority The following laws govern the operations of the Cooperative Extension line item for the Utah State University: - UCA 53B-18-201 establishes the agriculture extension services as provided by the Smith-Lever Acts.
- UCA 53B-18-601 creates the Strengthening At-Risk Youth and Their Families Program.
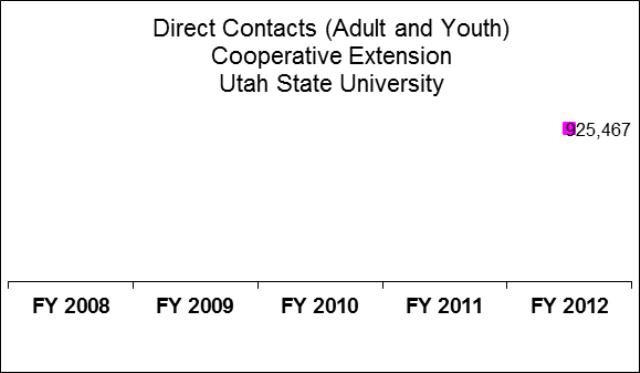
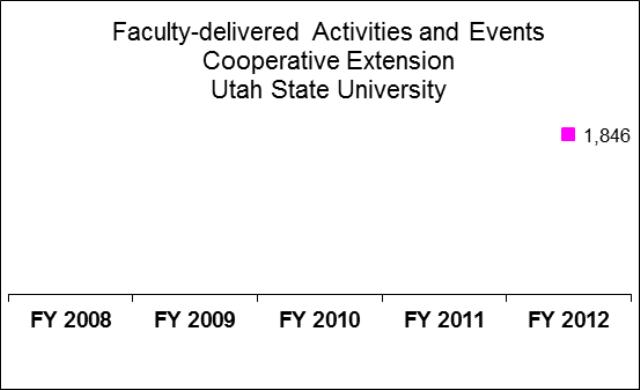
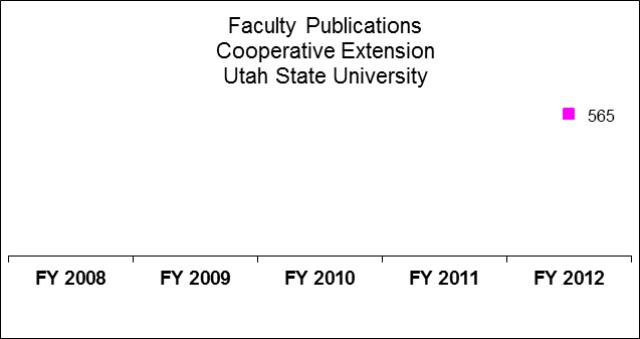
Performance The Cooperative Extension program identifies direct contacts, activities and events deliverd by its faculty, and publications by its faculty as indications of its performance.


 Funding Detail For more detail about a particular source of finance or organizational unit, click a linked entry in the left column of the table(s) below. Sources of Finance
(click linked fund name for more info) | 2009
Actual | 2010
Actual | 2011
Actual | 2012
Actual | 2013
Approp | | General Fund | $874,800 | $328,800 | $541,600 | $1,049,400 | $948,900 | | General Fund, One-time | $0 | $1,085,800 | $0 | $10,000 | $0 | | Education Fund | $12,774,800 | $11,004,500 | $11,004,500 | $10,922,100 | $11,029,900 | | Federal Funds | $1,809,200 | $2,241,300 | $2,508,000 | $2,210,200 | $2,088,500 | | Dedicated Credits Revenue | $33,000 | $28,600 | $26,400 | $27,300 | $0 | | Transfers - HED | $300 | $0 | $0 | $0 | $0 | | Beginning Nonlapsing | $1,432,500 | $359,600 | $1,399,800 | $1,945,700 | $1,945,700 | | Closing Nonlapsing | ($359,600) | ($1,399,800) | ($1,945,700) | ($2,268,900) | ($1,945,700) | | Total | $16,565,000 | $13,648,800 | $13,534,600 | $13,895,800 | $14,067,300 |
|---|
| | | | | | Programs:
(click linked program name to drill-down) | 2009
Actual | 2010
Actual | 2011
Actual | 2012
Actual | 2013
Approp |
|---|
| Cooperative Extension | $16,565,000 | $13,648,800 | $13,534,600 | $13,895,800 | $14,067,300 | | Total | $16,565,000 | $13,648,800 | $13,534,600 | $13,895,800 | $14,067,300 |
|---|
| | | | | | Categories of Expenditure
(mouse-over category name for definition) | 2009
Actual | 2010
Actual | 2011
Actual | 2012
Actual | 2013
Approp |
|---|
| Personnel Services | $13,461,800 | $11,778,900 | $11,975,300 | $12,265,700 | $12,563,400 | | In-state Travel | $350,800 | $322,200 | $358,000 | $396,500 | $0 | | Current Expense | $1,195,100 | $1,489,300 | $1,545,900 | $967,800 | $1,380,300 | | Capital Outlay | $62,900 | $96,100 | $19,600 | $31,800 | $0 | | Other Charges/Pass Thru | $1,494,400 | ($37,700) | ($364,200) | $234,000 | $123,600 | | Total | $16,565,000 | $13,648,800 | $13,534,600 | $13,895,800 | $14,067,300 |
|---|
| | | | | | | Other Indicators | 2009
Actual | 2010
Actual | 2011
Actual | 2012
Actual | 2013
Approp |
|---|
| Budgeted FTE | 163.6 | 162.6 | 150.5 | 143.8 | 143.8 | | Actual FTE | 150.8 | 133.9 | 134.9 | 139.6 | 0.0 |
|
|
|
|
|
|
|---|
Subcommittee Table of Contents |


