Agency: School & Inst Trust Lands Line Item: School & Inst Trust Lands Statutory Authority The following laws govern operations of SITLA:
- UCA 53C-3 is known as the "School and Institutional Trust Lands Management Act." Highlights include:
- The state has a duty of undivided loyalty to the beneficiaries.
- The administration is an independent state agency and not a division of any other department.
- The administration is subject to most of the usual legislative and executive department controls. Certain exceptions are made in matters of confidentiality, rulemaking, personnel issues, and the procurement code.
- The board may create an annual incentive and bonus plan for the director and other administration employees designated by the board, based upon reaching measurable goals.
- The administration is managed by a director appointed by the Board of Trustees.
- UCA 53C-1-202 creates the seven-member Board of Trustees. Members are appointed on a nonpartisan basis by the governor with the consent of the Senate.
- UCA 53C-1-204 spells out requirements for the policies established by the board.
- UCA 53C-3 creates the Land Grant Management Fund. Revenue comes from:
- all revenues derived from trust lands except revenues from the sales of those lands
- all interest earned by the fund
- all revenues obtained from other activities of the agency
- money from sales of school trust lands is deposited in the Permanent State School Fund.
- UCA 53C-3-101 allows the director to expend monies from the fund in accordance with the approved budget to support the agency. Any unspent amount is distributed back to the beneficiaries.
- UCA 53C-3-104 requires money from the sale or management of reservoir lands to be deposited in the Water Resources Construction Fund created in UCA 73-10-8.
- 53C-3-202 details collection and distributions of revenues from federal land exchange parcels.
Performance The following are the top measures chosen by the agency management to gauge the success of its programs. RS 2477: The first performance measure tracks the road miles analyzed and perfected as permanent easements or acknowledged by Disclaimer of Interest. The agency goal is to analyze and issue easements or Disclaimers of Interest on mileage of Class B county roads within 5 counties each year. No goal is set for the mileage per year because as this varies widely by county. 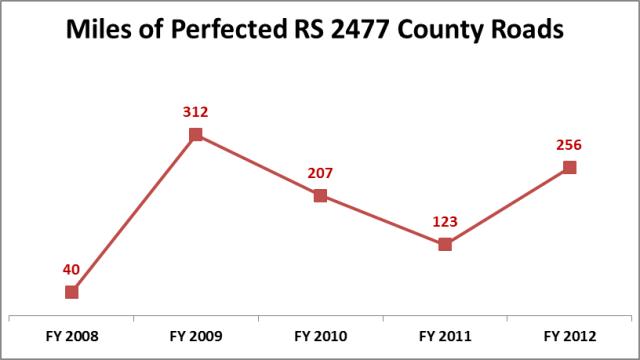 Audits: The second performance measure tracks the revenue recovered through auditing extraction companies operating on SITLA lands. 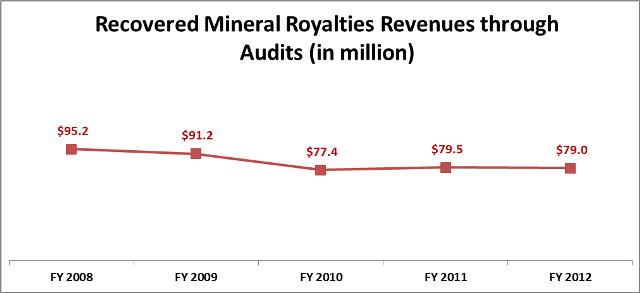 Funding Detail Funding for SITLA operations is provided through the Land Grant Management Fund (an enterprise fund), which consists of: - Revenues provided from trust land activities other than land sales. (Revenues from land sales go directly to the nonexpendable trust fund of the land's designated beneficiary).
- Revenues from other activities of the Administration.
Land use revenues include licenses, permit fees, royalties, and lease revenues charged for the use of trust lands. In exchange, SITLA allows the use of selected trust lands for activities such as grazing, logging, mineral extraction, and development. Revenues that have not been appropriated for use by SITLA are distributed directly to the beneficiaries or the Permanent School Fund. Unexpended appropriations to SITLA are also distributed to the beneficiaries or to their trust funds. In 1999 SITLA traded 377,000 acres of trust lands isolated within federal lands for $50 million cash, $13 million in future coal revenue, coal and coal bed methane, and 139,000 acres of land or surface/mineral rights with readily developable commercial and mineral value. Today those acquired lands are the base of the agency's single largest revenue source, natural gas royalties. The State Treasurer handles SITLA's investments. Interest and dividend income from the Permanent School Fund is directly distributed to individual schools through the Utah State Office of Education. Passage of Constitutional Amendment Number One (effective January 1, 2003), eliminated the requirement that a portion of interest earnings be held back as a protection against inflation, and clarified that stock dividends are part of the "interest" earnings that may be distributed. Sources of Finance
(click linked fund name for more info) | 2009
Actual | 2010
Actual | 2011
Actual | 2012
Actual | 2013
Approp | | Land Grant Management Fund | $9,971,900 | $9,703,600 | $9,462,400 | $9,119,700 | $9,372,600 | | Land Grant Mgt Fund, One-time | $0 | $0 | $1,111,300 | $721,300 | $346,300 | | Lapsing Balance | ($586,700) | ($1,117,500) | ($1,368,900) | ($214,100) | $0 | | Total | $9,385,200 | $8,586,100 | $9,204,800 | $9,626,900 | $9,718,900 |
|---|
| | | | | | Programs:
(click linked program name to drill-down) | 2009
Actual | 2010
Actual | 2011
Actual | 2012
Actual | 2013
Approp |
|---|
| Board | $365,100 | $121,200 | $73,800 | $92,100 | $88,500 | | Director | $708,200 | $508,100 | $530,000 | $553,500 | $788,700 | | Public Relations | $230,400 | $203,200 | $254,700 | $292,800 | $238,900 | | Administration | $948,100 | $945,800 | $935,100 | $996,800 | $965,300 | | Accounting | $371,700 | $354,400 | $354,500 | $349,200 | $391,000 | | Auditing | $368,500 | $331,900 | $334,600 | $316,200 | $359,600 | | Oil and Gas | $643,300 | $518,600 | $576,700 | $569,800 | $726,700 | | Mining | $498,100 | $467,800 | $408,600 | $536,500 | $677,800 | | Surface | $1,652,300 | $1,545,600 | $1,621,400 | $1,651,300 | $1,743,300 | | Development - Operating | $1,377,700 | $1,318,400 | $1,310,000 | $1,675,600 | $1,469,400 | | Legal/Contracts | $783,000 | $831,000 | $728,400 | $736,500 | $781,600 | | Data Processing | $979,400 | $992,100 | $1,679,500 | $1,418,700 | $983,500 | | Grazing and Forestry | $459,400 | $448,000 | $397,500 | $437,900 | $504,600 | | Total | $9,385,200 | $8,586,100 | $9,204,800 | $9,626,900 | $9,718,900 |
|---|
| | | | | | Categories of Expenditure
(mouse-over category name for definition) | 2009
Actual | 2010
Actual | 2011
Actual | 2012
Actual | 2013
Approp |
|---|
| Personnel Services | $6,963,600 | $6,397,700 | $6,424,600 | $6,423,100 | $6,777,700 | | In-state Travel | $85,300 | $88,100 | $59,300 | $62,100 | $128,800 | | Out-of-state Travel | $79,500 | $59,700 | $56,900 | $73,800 | $76,900 | | Current Expense | $2,008,400 | $1,792,200 | $1,780,800 | $2,362,600 | $2,538,600 | | DP Current Expense | $242,200 | $192,600 | $809,300 | $659,300 | $177,900 | | DP Capital Outlay | $0 | $35,400 | $48,600 | $20,100 | $0 | | Capital Outlay | $24,900 | $20,400 | $25,300 | $25,900 | $19,000 | | Other Charges/Pass Thru | ($18,700) | $0 | $0 | $0 | $0 | | Total | $9,385,200 | $8,586,100 | $9,204,800 | $9,626,900 | $9,718,900 |
|---|
| | | | | | | Other Indicators | 2009
Actual | 2010
Actual | 2011
Actual | 2012
Actual | 2013
Approp |
|---|
| Budgeted FTE | 69.8 | 67.5 | 77.1 | 75.0 | 79.2 | | Actual FTE | 72.9 | 73.0 | 71.4 | 71.2 | 0.0 | | Vehicles | 17 | 19 | 18 | 19 | 18 |
|
|
|
|
|
|
|---|
Subcommittee Table of ContentsProgram: Board Function The seven-member SITLA Board of Trustees is created in UCA 53C-1-202 . Its purpose as stated in UCA 53C-1-204 is to "�establish policies for the management of the School and Institutional Trust Lands Administration." Utah law requires the policies to: - be consistent with the Utah Enabling Act, the Utah Constitution, and state law;
- reflect undivided loyalty to the beneficiaries consistent with fiduciary duties;
- require the return of not less than fair market value for the use, sale, or exchange of school and institutional trust assets;
- seek to optimize trust land revenues and increase the value of trust land holdings consistent with the balancing of short and long-term interests, so that long-term benefits are not lost in an effort to maximize short-term gains;
- maintain the integrity of the trust and prevent the misapplication of its lands and its revenues; and
- have regard for and seek General Fund appropriation compensation for the general public's use of natural and cultural resources consistent with the duties of the administration as trustee for the beneficiaries.
Funding Detail Historically, the single largest expenditure in this program is the Board's incentive award package for senior management. Based on the action taken during the 2009 General Session, funding for the incentive program was removed from the base budget. Sources of Finance
(click linked fund name for more info) | 2009
Actual | 2010
Actual | 2011
Actual | 2012
Actual | 2013
Approp | | Land Grant Management Fund | $365,100 | $121,200 | $89,000 | $88,500 | $88,500 | | Lapsing Balance | $0 | $0 | ($15,200) | $3,600 | $0 | | Total | $365,100 | $121,200 | $73,800 | $92,100 | $88,500 |
|---|
| | | | | | Categories of Expenditure
(mouse-over category name for definition) | 2009
Actual | 2010
Actual | 2011
Actual | 2012
Actual | 2013
Approp |
|---|
| Personnel Services | $352,400 | $66,700 | $64,900 | $74,400 | $30,700 | | In-state Travel | $3,300 | $4,700 | $2,300 | $3,200 | $7,500 | | Out-of-state Travel | $700 | $600 | $1,700 | $3,700 | $2,800 | | Current Expense | $8,700 | $49,200 | $4,900 | $10,800 | $47,500 | | Total | $365,100 | $121,200 | $73,800 | $92,100 | $88,500 |
|---|
| | | | | | | Other Indicators | 2009
Actual | 2010
Actual | 2011
Actual | 2012
Actual | 2013
Approp |
|---|
| Budgeted FTE | 0.5 | 0.5 | 0.5 | 1.0 | 0.5 | | Actual FTE | 0.5 | 0.5 | 0.5 | 0.4 | 0.0 |
|
|
|
|
|
|
|---|
Subcommittee Table of ContentsProgram: Director Function The Director of the School and Institutional Trust Lands Administration is required by statute to "...manage the School and Institutional Trust Lands Administration in fulfillment of its purpose." That purpose has been identified in UCA 53C-1-102 to "�manage the lands and revenues generated from the lands in the most prudent and profitable manner possible, and not for any purpose inconsistent with the best interest of the trust beneficiaries." The office consists of the director and an associate director. Aside from personal services, the largest costs consist of consulting contracts. Funding Detail Sources of Finance
(click linked fund name for more info) | 2009
Actual | 2010
Actual | 2011
Actual | 2012
Actual | 2013
Approp | | Land Grant Management Fund | $708,200 | $641,500 | $479,500 | $478,900 | $488,700 | | Land Grant Mgt Fund, One-time | $0 | $0 | $300,000 | $300,000 | $300,000 | | Lapsing Balance | $0 | ($133,400) | ($249,500) | ($225,400) | $0 | | Total | $708,200 | $508,100 | $530,000 | $553,500 | $788,700 |
|---|
| | | | | | Categories of Expenditure
(mouse-over category name for definition) | 2009
Actual | 2010
Actual | 2011
Actual | 2012
Actual | 2013
Approp |
|---|
| Personnel Services | $490,400 | $348,000 | $359,400 | $372,100 | $379,000 | | In-state Travel | $12,200 | $6,800 | $6,800 | $10,700 | $14,900 | | Out-of-state Travel | $31,300 | $21,500 | $25,100 | $25,300 | $19,200 | | Current Expense | $174,200 | $131,700 | $136,900 | $143,400 | $374,800 | | DP Current Expense | $100 | $100 | $1,800 | $2,000 | $800 | | Total | $708,200 | $508,100 | $530,000 | $553,500 | $788,700 |
|---|
| | | | | | | Other Indicators | 2009
Actual | 2010
Actual | 2011
Actual | 2012
Actual | 2013
Approp |
|---|
| Budgeted FTE | 3.0 | 3.0 | 2.0 | 2.0 | 2.0 | | Actual FTE | 3.0 | 2.0 | 2.0 | 2.0 | 0.0 | | Vehicles | 17 | 1 | 1 | 1 | 1 |
|
|
|
|
|
|
|---|
Subcommittee Table of ContentsProgram: Public Relations Function The Public Relations program consists of the public affairs officer and an information specialist with the goal to gain the necessary political and public support for SITLA to accomplish its mission: "to administer the trust lands prudently and profitably for Utah's schoolchildren." Funding Detail Sources of Finance
(click linked fund name for more info) | 2009
Actual | 2010
Actual | 2011
Actual | 2012
Actual | 2013
Approp | | Land Grant Management Fund | $230,400 | $232,300 | $234,800 | $234,400 | $238,900 | | Lapsing Balance | $0 | ($29,100) | $19,900 | $58,400 | $0 | | Total | $230,400 | $203,200 | $254,700 | $292,800 | $238,900 |
|---|
| | | | | | Categories of Expenditure
(mouse-over category name for definition) | 2009
Actual | 2010
Actual | 2011
Actual | 2012
Actual | 2013
Approp |
|---|
| Personnel Services | $189,300 | $174,000 | $183,900 | $183,100 | $188,600 | | In-state Travel | $1,100 | $1,800 | $1,200 | $1,000 | $0 | | Out-of-state Travel | $2,400 | $2,600 | $900 | $1,800 | $3,000 | | Current Expense | $37,600 | $24,800 | $68,700 | $106,700 | $47,300 | | DP Current Expense | $0 | $0 | $0 | $200 | $0 | | Total | $230,400 | $203,200 | $254,700 | $292,800 | $238,900 |
|---|
| | | | | | | Other Indicators | 2009
Actual | 2010
Actual | 2011
Actual | 2012
Actual | 2013
Approp |
|---|
| Budgeted FTE | 2.0 | 2.0 | 2.0 | 2.0 | 2.0 | | Actual FTE | 2.0 | 2.0 | 2.0 | 2.0 | 0.0 |
|
|
|
|
|
|
|---|
Subcommittee Table of ContentsProgram: Administration Function The SITLA Administration program includes the administrative assistant and the office staff that provide support for the rest of the agency. Costs for rent, office supplies, and insurance are paid out of this program. Staff in this program also supports the Board of Trustees. Funding Detail Sources of Finance
(click linked fund name for more info) | 2009
Actual | 2010
Actual | 2011
Actual | 2012
Actual | 2013
Approp | | Land Grant Management Fund | $1,534,800 | $956,200 | $955,100 | $953,800 | $965,300 | | Lapsing Balance | ($586,700) | ($10,400) | ($20,000) | $43,000 | $0 | | Total | $948,100 | $945,800 | $935,100 | $996,800 | $965,300 |
|---|
| | | | | | Categories of Expenditure
(mouse-over category name for definition) | 2009
Actual | 2010
Actual | 2011
Actual | 2012
Actual | 2013
Approp |
|---|
| Personnel Services | $275,900 | $270,500 | $271,500 | $293,800 | $273,800 | | In-state Travel | $1,300 | $1,100 | $800 | $400 | $1,800 | | Current Expense | $662,600 | $664,400 | $652,000 | $691,400 | $682,900 | | DP Current Expense | $8,300 | $9,800 | $10,800 | $11,200 | $6,800 | | Total | $948,100 | $945,800 | $935,100 | $996,800 | $965,300 |
|---|
| | | | | | | Other Indicators | 2009
Actual | 2010
Actual | 2011
Actual | 2012
Actual | 2013
Approp |
|---|
| Budgeted FTE | 4.6 | 5.0 | 5.8 | 5.0 | 5.8 | | Actual FTE | 4.6 | 4.8 | 4.7 | 5.3 | 0.0 |
|
|
|
|
|
|
|---|
Subcommittee Table of ContentsProgram: Accounting Function SITLA Accounting program accounts for all revenue and expenditures of the agency from trust lands. It is responsible for developing and coordinating the budget and the review process before the Board of Trustees and other committees. Additional responsibilities include setting up, creating and maintaining financial data, reporting, payroll, coordinating investments with the State Treasurer, and managing the accounting aspects of the business system for the agency. Funding Detail Sources of Finance
(click linked fund name for more info) | 2009
Actual | 2010
Actual | 2011
Actual | 2012
Actual | 2013
Approp | | Land Grant Management Fund | $371,700 | $377,200 | $382,900 | $381,700 | $391,000 | | Lapsing Balance | $0 | ($22,800) | ($28,400) | ($32,500) | $0 | | Total | $371,700 | $354,400 | $354,500 | $349,200 | $391,000 |
|---|
| | | | | | Categories of Expenditure
(mouse-over category name for definition) | 2009
Actual | 2010
Actual | 2011
Actual | 2012
Actual | 2013
Approp |
|---|
| Personnel Services | $361,000 | $343,500 | $343,700 | $338,900 | $372,800 | | In-state Travel | $600 | $300 | $0 | $200 | $3,000 | | Out-of-state Travel | $1,300 | $2,500 | $2,100 | $2,100 | $3,800 | | Current Expense | $6,100 | $5,400 | $6,000 | $5,200 | $8,600 | | DP Current Expense | $2,700 | $2,700 | $2,700 | $2,800 | $2,800 | | Total | $371,700 | $354,400 | $354,500 | $349,200 | $391,000 |
|---|
| | | | | | | Other Indicators | 2009
Actual | 2010
Actual | 2011
Actual | 2012
Actual | 2013
Approp |
|---|
| Budgeted FTE | 3.9 | 5.0 | 4.2 | 5.0 | 3.9 | | Actual FTE | 3.9 | 3.9 | 3.6 | 3.7 | 0.0 |
|
|
|
|
|
|
|---|
Subcommittee Table of ContentsProgram: Auditing Function The Auditing program consists of 3 full-time auditors and contracts auditors as needed, with the goal to ensure lease/contract/vendor compliance and adherence with agency rules and statutes. If inconsistencies are found, the program issues assessments and works with agency attorneys to collect assessments as needed. Staff also performs internal reviews and provides recommendations to the director and board audit committee. Funding Detail Sources of Finance
(click linked fund name for more info) | 2009
Actual | 2010
Actual | 2011
Actual | 2012
Actual | 2013
Approp | | Land Grant Management Fund | $368,500 | $349,700 | $354,000 | $352,400 | $359,600 | | Lapsing Balance | $0 | ($17,800) | ($19,400) | ($36,200) | $0 | | Total | $368,500 | $331,900 | $334,600 | $316,200 | $359,600 |
|---|
| | | | | | Categories of Expenditure
(mouse-over category name for definition) | 2009
Actual | 2010
Actual | 2011
Actual | 2012
Actual | 2013
Approp |
|---|
| Personnel Services | $287,300 | $280,700 | $278,300 | $280,400 | $310,400 | | In-state Travel | $900 | $300 | $500 | $400 | $1,600 | | Out-of-state Travel | $8,500 | $4,800 | $9,500 | $9,600 | $7,400 | | Current Expense | $70,800 | $45,000 | $45,200 | $24,500 | $39,200 | | DP Current Expense | $1,000 | $1,100 | $1,100 | $1,300 | $1,000 | | Total | $368,500 | $331,900 | $334,600 | $316,200 | $359,600 |
|---|
| | | | | | | Other Indicators | 2009
Actual | 2010
Actual | 2011
Actual | 2012
Actual | 2013
Approp |
|---|
| Budgeted FTE | 3.0 | 3.0 | 3.0 | 3.0 | 3.0 | | Actual FTE | 3.0 | 3.0 | 3.0 | 3.0 | 0.0 |
|
|
|
|
|
|
|---|
Subcommittee Table of ContentsProgram: Oil and Gas Function The Oil and Gas program manages and administers approximately 4.6 million acres of oil, gas, and hydrocarbon rights held in trust. Oil and Gas assets must be managed under strict fiduciary guidelines with focus on generating revenue today and protecting long-term assets for the future. Staff engages in managing the oil and gas assets, enforcing existing contractual rights, leasing, and attracting industry to trust lands for exploration and development. Funding Detail Sources of Finance
(click linked fund name for more info) | 2009
Actual | 2010
Actual | 2011
Actual | 2012
Actual | 2013
Approp | | Land Grant Management Fund | $643,300 | $632,200 | $639,200 | $618,500 | $726,700 | | Land Grant Mgt Fund, One-time | $0 | $0 | $50,000 | $0 | $0 | | Lapsing Balance | $0 | ($113,600) | ($112,500) | ($48,700) | $0 | | Total | $643,300 | $518,600 | $576,700 | $569,800 | $726,700 |
|---|
| | | | | | Categories of Expenditure
(mouse-over category name for definition) | 2009
Actual | 2010
Actual | 2011
Actual | 2012
Actual | 2013
Approp |
|---|
| Personnel Services | $488,100 | $447,700 | $459,500 | $455,100 | $539,500 | | In-state Travel | $3,900 | $3,400 | $3,700 | $2,900 | $7,700 | | Out-of-state Travel | $5,400 | $4,800 | $3,400 | $7,000 | $6,100 | | Current Expense | $150,000 | $57,800 | $105,800 | $101,500 | $172,000 | | DP Current Expense | $3,600 | $4,000 | $2,800 | $2,900 | $1,400 | | Capital Outlay | $0 | $900 | $1,500 | $400 | $0 | | Other Charges/Pass Thru | ($7,700) | $0 | $0 | $0 | $0 | | Total | $643,300 | $518,600 | $576,700 | $569,800 | $726,700 |
|---|
| | | | | | | Other Indicators | 2009
Actual | 2010
Actual | 2011
Actual | 2012
Actual | 2013
Approp |
|---|
| Budgeted FTE | 6.0 | 4.0 | 5.6 | 6.0 | 7.0 | | Actual FTE | 6.0 | 4.8 | 4.7 | 4.7 | 0.0 | | Vehicles | 0 | 1 | 1 | 1 | 1 |
|
|
|
|
|
|
|---|
Subcommittee Table of ContentsProgram: Mining Function Just like the Oil and Gas program, the Mining program manages and administers approximately 4.6 million acres of solid mineral rights held in trust lands. Staff is marketing the mineral assets, enforcing existing contractual rights, leasing, and attracting industry to trust lands for exploration and development. Until FY 2008, this program was combined with the Oil and Gas program. Funding Detail Sources of Finance
(click linked fund name for more info) | 2009
Actual | 2010
Actual | 2011
Actual | 2012
Actual | 2013
Approp | | Land Grant Management Fund | $498,100 | $764,700 | $825,100 | $665,800 | $677,800 | | Lapsing Balance | $0 | ($296,900) | ($416,500) | ($129,300) | $0 | | Total | $498,100 | $467,800 | $408,600 | $536,500 | $677,800 |
|---|
| | | | | | Categories of Expenditure
(mouse-over category name for definition) | 2009
Actual | 2010
Actual | 2011
Actual | 2012
Actual | 2013
Approp |
|---|
| Personnel Services | $376,400 | $330,900 | $283,400 | $383,900 | $473,800 | | In-state Travel | $1,300 | $1,100 | $900 | $1,000 | $2,100 | | Out-of-state Travel | $1,800 | $0 | $0 | $1,100 | $2,000 | | Current Expense | $116,300 | $133,600 | $122,000 | $148,100 | $199,900 | | DP Current Expense | $2,300 | $2,200 | $2,300 | $2,400 | $0 | | Total | $498,100 | $467,800 | $408,600 | $536,500 | $677,800 |
|---|
| | | | | | | Other Indicators | 2009
Actual | 2010
Actual | 2011
Actual | 2012
Actual | 2013
Approp |
|---|
| Budgeted FTE | 0.0 | 5.0 | 5.6 | 5.0 | 5.6 | | Actual FTE | 3.1 | 4.2 | 3.8 | 4.4 | 0.0 | | Vehicles | 0 | 1 | 1 | 1 | 1 |
|
|
|
|
|
|
|---|
Subcommittee Table of ContentsProgram: Surface Function The Surface program administers the surface uses of the trust lands. Surface activities include leasing for such uses as telecommunications sites, industrial and commercial enterprises and residential purposes, as well as easements, permits, rights-of-way, and sales. Funding Detail Sources of Finance
(click linked fund name for more info) | 2009
Actual | 2010
Actual | 2011
Actual | 2012
Actual | 2013
Approp | | Land Grant Management Fund | $1,652,300 | $1,765,400 | $1,736,700 | $1,666,000 | $1,697,000 | | Land Grant Mgt Fund, One-time | $0 | $0 | $46,300 | $46,300 | $46,300 | | Lapsing Balance | $0 | ($219,800) | ($161,600) | ($61,000) | $0 | | Total | $1,652,300 | $1,545,600 | $1,621,400 | $1,651,300 | $1,743,300 |
|---|
| | | | | | Categories of Expenditure
(mouse-over category name for definition) | 2009
Actual | 2010
Actual | 2011
Actual | 2012
Actual | 2013
Approp |
|---|
| Personnel Services | $1,398,700 | $1,318,000 | $1,420,500 | $1,392,000 | $1,460,500 | | In-state Travel | $16,900 | $31,200 | $18,300 | $18,000 | $28,700 | | Out-of-state Travel | $5,700 | $4,900 | $2,800 | $7,600 | $8,200 | | Current Expense | $206,400 | $169,900 | $162,000 | $216,000 | $213,000 | | DP Current Expense | $19,300 | $15,600 | $15,500 | $16,500 | $13,900 | | Capital Outlay | $5,300 | $6,000 | $2,300 | $1,200 | $19,000 | | Total | $1,652,300 | $1,545,600 | $1,621,400 | $1,651,300 | $1,743,300 |
|---|
| | | | | | | Other Indicators | 2009
Actual | 2010
Actual | 2011
Actual | 2012
Actual | 2013
Approp |
|---|
| Budgeted FTE | 17.5 | 13.0 | 18.2 | 16.0 | 19.0 | | Actual FTE | 17.6 | 17.4 | 18.5 | 18.2 | 0.0 | | Vehicles | 0 | 5 | 5 | 6 | 5 |
|
|
|
|
|
|
|---|
Subcommittee Table of ContentsProgram: Development - Operating Funding Detail The budget reflected here represents the cost of operating the Development program, which includes oversight of the capital budget and project management. Sources of Finance
(click linked fund name for more info) | 2009
Actual | 2010
Actual | 2011
Actual | 2012
Actual | 2013
Approp | | Land Grant Management Fund | $1,377,700 | $1,479,100 | $1,553,400 | $1,447,700 | $1,469,400 | | Lapsing Balance | $0 | ($160,700) | ($243,400) | $227,900 | $0 | | Total | $1,377,700 | $1,318,400 | $1,310,000 | $1,675,600 | $1,469,400 |
|---|
| | | | | | Categories of Expenditure
(mouse-over category name for definition) | 2009
Actual | 2010
Actual | 2011
Actual | 2012
Actual | 2013
Approp |
|---|
| Personnel Services | $1,166,500 | $1,146,400 | $1,105,000 | $1,063,100 | $1,077,500 | | In-state Travel | $16,200 | $16,400 | $11,500 | $8,400 | $38,700 | | Out-of-state Travel | $9,800 | $4,300 | $6,500 | $2,900 | $9,200 | | Current Expense | $149,800 | $136,200 | $159,400 | $584,600 | $337,800 | | DP Current Expense | $11,400 | $6,900 | $6,900 | $7,200 | $6,200 | | Capital Outlay | $24,000 | $8,200 | $20,700 | $9,400 | $0 | | Total | $1,377,700 | $1,318,400 | $1,310,000 | $1,675,600 | $1,469,400 |
|---|
| | | | | | | Other Indicators | 2009
Actual | 2010
Actual | 2011
Actual | 2012
Actual | 2013
Approp |
|---|
| Budgeted FTE | 12.9 | 12.0 | 12.0 | 12.0 | 11.0 | | Actual FTE | 12.9 | 12.0 | 11.2 | 11.0 | 0.0 | | Vehicles | 0 | 5 | 4 | 4 | 4 |
|
|
|
|
|
|
|---|
Subcommittee Table of ContentsProgram: Legal/Contracts Function The Legal/Contracts program defends and prosecutes lawsuits and pursues administrative adjudication involving the agency, drafts and/or reviews regulations, and provides general legal advice to the agency. Although statute requires most agencies to use attorneys from the Attorney General's office, the Legislature has allowed SITLA to keep a separate legal staff. Funding Detail Sources of Finance
(click linked fund name for more info) | 2009
Actual | 2010
Actual | 2011
Actual | 2012
Actual | 2013
Approp | | Land Grant Management Fund | $783,000 | $831,000 | $779,400 | $768,400 | $781,600 | | Lapsing Balance | $0 | $0 | ($51,000) | ($31,900) | $0 | | Total | $783,000 | $831,000 | $728,400 | $736,500 | $781,600 |
|---|
| | | | | | Categories of Expenditure
(mouse-over category name for definition) | 2009
Actual | 2010
Actual | 2011
Actual | 2012
Actual | 2013
Approp |
|---|
| Personnel Services | $544,900 | $616,700 | $563,500 | $556,700 | $590,400 | | In-state Travel | $8,100 | $8,500 | $7,000 | $7,400 | $5,200 | | Out-of-state Travel | $1,700 | $5,200 | $1,300 | $3,900 | $6,600 | | Current Expense | $216,100 | $196,900 | $153,100 | $164,600 | $176,100 | | DP Current Expense | $3,400 | $3,700 | $3,500 | $3,900 | $3,300 | | Capital Outlay | $8,800 | $0 | $0 | $0 | $0 | | Total | $783,000 | $831,000 | $728,400 | $736,500 | $781,600 |
|---|
| | | | | | | Other Indicators | 2009
Actual | 2010
Actual | 2011
Actual | 2012
Actual | 2013
Approp |
|---|
| Budgeted FTE | 5.7 | 5.0 | 6.5 | 6.0 | 7.0 | | Actual FTE | 5.7 | 6.7 | 5.7 | 5.9 | 0.0 | | Vehicles | 0 | 2 | 2 | 2 | 2 |
|
|
|
|
|
|
|---|
Subcommittee Table of ContentsProgram: Data Processing Function The Information Technology group provides and maintains two mission-critical applications: (1) Maintain a complete land inventory of all surface and subsurface ownership; complete lease, contract, and sale information; process and disperse all revenue to the appropriate beneficiaries; and (2) Provide all associated IT tasks necessary to support the agency. Funding Detail Sources of Finance
(click linked fund name for more info) | 2009
Actual | 2010
Actual | 2011
Actual | 2012
Actual | 2013
Approp | | Land Grant Management Fund | $979,400 | $1,017,200 | $897,600 | $969,000 | $983,500 | | Land Grant Mgt Fund, One-time | $0 | $0 | $715,000 | $375,000 | $0 | | Lapsing Balance | $0 | ($25,100) | $66,900 | $74,700 | $0 | | Total | $979,400 | $992,100 | $1,679,500 | $1,418,700 | $983,500 |
|---|
| | | | | | Categories of Expenditure
(mouse-over category name for definition) | 2009
Actual | 2010
Actual | 2011
Actual | 2012
Actual | 2013
Approp |
|---|
| Personnel Services | $718,500 | $766,100 | $802,900 | $740,500 | $781,000 | | In-state Travel | $1,500 | $1,900 | $2,100 | $1,600 | $1,500 | | Out-of-state Travel | $7,200 | $6,200 | $3,600 | $6,300 | $5,200 | | Current Expense | $63,600 | $37,700 | $62,100 | $42,900 | $54,100 | | DP Current Expense | $188,600 | $144,800 | $760,200 | $607,300 | $141,700 | | DP Capital Outlay | $0 | $35,400 | $48,600 | $20,100 | $0 | | Total | $979,400 | $992,100 | $1,679,500 | $1,418,700 | $983,500 |
|---|
| | | | | | | Other Indicators | 2009
Actual | 2010
Actual | 2011
Actual | 2012
Actual | 2013
Approp |
|---|
| Budgeted FTE | 7.3 | 7.0 | 8.5 | 9.0 | 8.5 | | Actual FTE | 7.3 | 8.6 | 8.5 | 7.7 | 0.0 |
|
|
|
|
|
|
|---|
Subcommittee Table of ContentsProgram: Grazing and Forestry Function The Grazing and Forestry program administers the renewable resources of approximately 3.4 million acres of trust land. Activities include issuing permits for grazing, harvesting small forest products, holding timber sales, and special use leases for agricultural products. This need is met by staff and contract labor that receive and process applications, inventory vegetation production for grazing, and inventory and mark timber for sales. Funding Detail Sources of Finance
(click linked fund name for more info) | 2009
Actual | 2010
Actual | 2011
Actual | 2012
Actual | 2013
Approp | | Land Grant Management Fund | $459,400 | $535,900 | $535,700 | $494,600 | $504,600 | | Lapsing Balance | $0 | ($87,900) | ($138,200) | ($56,700) | $0 | | Total | $459,400 | $448,000 | $397,500 | $437,900 | $504,600 |
|---|
| | | | | | Categories of Expenditure
(mouse-over category name for definition) | 2009
Actual | 2010
Actual | 2011
Actual | 2012
Actual | 2013
Approp |
|---|
| Personnel Services | $314,200 | $288,500 | $288,100 | $289,100 | $299,700 | | In-state Travel | $18,000 | $10,600 | $4,200 | $6,900 | $16,100 | | Out-of-state Travel | $3,700 | $2,300 | $0 | $2,500 | $3,400 | | Current Expense | $146,200 | $139,600 | $102,700 | $122,900 | $185,400 | | DP Current Expense | $1,500 | $1,700 | $1,700 | $1,600 | $0 | | Capital Outlay | ($13,200) | $5,300 | $800 | $14,900 | $0 | | Other Charges/Pass Thru | ($11,000) | $0 | $0 | $0 | $0 | | Total | $459,400 | $448,000 | $397,500 | $437,900 | $504,600 |
|---|
| | | | | | | Other Indicators | 2009
Actual | 2010
Actual | 2011
Actual | 2012
Actual | 2013
Approp |
|---|
| Budgeted FTE | 3.3 | 3.0 | 3.2 | 3.0 | 4.0 | | Actual FTE | 3.3 | 3.1 | 3.2 | 2.9 | 0.0 | | Vehicles | 0 | 4 | 4 | 4 | 4 |
|
|
|
|
|
|
|---|
Subcommittee Table of Contents |