Compendium of Budget Information for the 2013 General Session
| Business, Economic Development, & Labor Appropriations Subcommittee | ||||||||||||||||||||||||||||||||||||||||||||||||||||||||||||||||||||||||||||||||||||||||||||||||||||||||||||||||||||||||||||||||||||||||||||||||||||||||||||||||||||||||||||||||||||||||||||||||||||||||||||||||||||||||||||||||||||||||||||||||||||||||||||||||||||||||||||||||||||||||||||||||||||||||||||||||||
| <-Previous Page | Subcommittee Table of Contents | Next Page-> | ||||||||||||||||||||||||||||||||||||||||||||||||||||||||||||||||||||||||||||||||||||||||||||||||||||||||||||||||||||||||||||||||||||||||||||||||||||||||||||||||||||||||||||||||||||||||||||||||||||||||||||||||||||||||||||||||||||||||||||||||||||||||||||||||||||||||||||||||||||||||||||||||||||||||||||||||||
Agency: Financial Institutions Line Item: Financial Institutions Administration Function Financial Institutions has two programs: 1) Administration, which includes all department programs and activities; and 2) Building Operations and Maintenance, which tracks rent separately from everyday operations. Funding Detail For more detail about a particular source of finance or organizational unit, click a linked entry in the left column of the table(s) below.
Function The Administration program carries out all of the regulatory functions and other duties outlined in statue for the department and employs 52 people to accomplish these duties. It regulates 89 depository institutions including: 28 commercial banks, 42 credit unions, and 19 industrial banks. It also regulates 2 trust companies, 56 travelers check or money order issuers, 4 independent escrow companies, 61 check cashers, 179 deferred deposit lenders, 72 title lenders and 176 residential first mortgage loan servicers. Two primary goals are 1) to complete the number of examinations required to maintain the health of the State-chartered banking and credit union systems in Utah and 2) to remain accredited by its state regulatory peers in an interstate banking environment. Performance The optimum number of examinations required each fiscal year is based upon the number of institutions under the department's jurisdiction. The financial condition of the institutions and the industry also influences the number of examinations. Each depository institution, deferred deposit lender, check cashers, and title lender is examined at least once every 12 to 15 months. The department performed 858 total examinations in FY 2012. These examinations include: safety and soundness, specialty, follow-up, and non-depository lender. The following chart is a historical graph of the department's examination performance.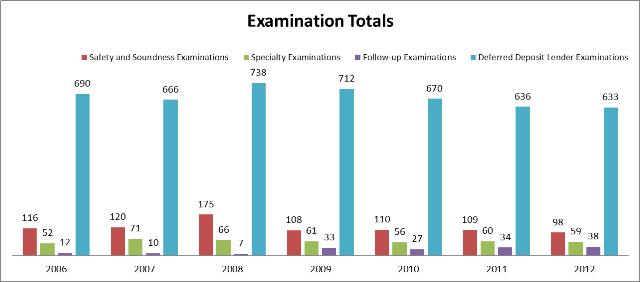 The Conference of State Bank Supervisors (CSBS) and the National Association of State Credit Union Supervisors (NASCUS) are two organizations that oversee accreditation requirements and standards nationwide. In order to maintain their accreditation, departments must maintain a 75% rating with each of these organizations. The Department most recently received a score of 86.2% from CSBS and a score of 92.92% from NASCUS. Funding Detail
Program: Building Operations and Maintenance Function The department of Financial Institutions is located on the second floor at 324 South State Street. This downtown Salt Lake City office space is located in an area of escalating lease expenses. Parking is provided on site. The Department's lease is well within the acceptable range established by the Division of Facilities Construction and Management (DFCM). Funding Detail
| ||||||||||||||||||||||||||||||||||||||||||||||||||||||||||||||||||||||||||||||||||||||||||||||||||||||||||||||||||||||||||||||||||||||||||||||||||||||||||||||||||||||||||||||||||||||||||||||||||||||||||||||||||||||||||||||||||||||||||||||||||||||||||||||||||||||||||||||||||||||||||||||||||||||||||||||||||
| <-Previous Page | Next Page-> |
COBI contains unaudited data as presented to the Legislature by state agencies at the time of publication. For audited financial data see the State of Utah's Comprehensive Annual Financial Reports.