Compendium of Budget Information for the 2013 General Session
| Business, Economic Development, & Labor Appropriations Subcommittee | ||||||||||||||||||||||||||||||||||||||||||||||||||||||||||||||||||||||||||||||||||||||||||||||||||||||||||||||||||||||||||||||||||||||||||||||||||||||||||||||||||||||||||||||||||||||||||||||||||||||||||||||||||||||||||||||||||||||||||||||||||||||||||||||||||||||||||||||||||||||||||||||||||||||||||||||||||||||||||||||||||||||||||||||||||||||||||||||||||||||||||||||||||||||||||||||||||||||||||||||||||||||||||||||
| <-Previous Page | Subcommittee Table of Contents | Next Page-> | ||||||||||||||||||||||||||||||||||||||||||||||||||||||||||||||||||||||||||||||||||||||||||||||||||||||||||||||||||||||||||||||||||||||||||||||||||||||||||||||||||||||||||||||||||||||||||||||||||||||||||||||||||||||||||||||||||||||||||||||||||||||||||||||||||||||||||||||||||||||||||||||||||||||||||||||||||||||||||||||||||||||||||||||||||||||||||||||||||||||||||||||||||||||||||||||||||||||||||||||||||||||||||||||
Agency: Public Service Commission Line Item: Public Service Commission Function The Public Service Commission line item contains three programs: Intent Language
Funding Detail
Function The Public Service Commission is a quasi-judicial body that regulates all privately owned electricity, natural gas, some telecommunication companies, and water public utilities. The commission works to ensure that rates, terms, and conditions of utility service are "just and reasonable," to meet the public interest defined by statute and case law. Traditional regulation is still an important part of the commission's workload. In cooperation with the Division of Public Utilities (Department of Commerce), the Administration section functions largely to initiate investigations into situations where utilities may be in violation of the law, or are not operating in the public interest, and to set proper utility rates for service. Performance The top three performance measures identified by Administration are 1) Complaints 2) Customer service, and 3) Rates. These measures have been identified for tracking data beginning in FY 2014 and have no current results to show; they are discussed in more detail below. Complaints Administration has established a goal for FY 2014 to respond to public questions and complaints within three business days. However, depending on the type of question or complaint, some responses may take additional time because of investigation needs or certain rule processes that are required to be followed. The intent of this goal is to respond quickly to general complaints and questions within a timely framework that is allowed by rule and statutory process. Customer Service For FY 2014, Administration has set a goal to post filed documents to the Public Service Commission's website within three business days Rates Administration benchmarks Utah utility rates with other states and has set a goal to ensure that Utah rates do not increase faster than other states served by the same utilities. Rates for PacifiCorp and Questar Gas Company have been compiled and listed below. .jpg) Results: PacifiCorp rates in Utah did not increase faster than other states served by PacifiCorp. Data Compiled from the US Department of Energy, Energy Information Administration Table 10. Class of ownership, number of consumers, sales, revenue, and average retail price by State and utility: all sectors, years 2008, 2009, 2010 and 2011 Mcf Definition: An abbreviation denoting a thousand cubic feet of natural gas. A natural gas well that produces 400 Mcf of gas per day operates with a daily production rate of 400,000. A single Mcf is equal to approximately 1,000,000 Btu (British thermal units) of energy. The "M" in MCF comes from the ancient Roman letter M, which stood for one thousand. One million cubic feet is instead denoted as MMcf. http://www.investopedia.com/terms/m/mcf.asp#ixzz2AFeKhdBi .jpg) .jpg) .jpg) Results: rates did not increase faster than other states served by Questar Gas Company except for industrial natural gas transport rates; absolute rates are generally lower in Utah in 2011; Utah has more stable prices, likely due to effect of Company-owned, cost of service gas. Compiled from US Department of Energy, Energy Information Administration Natural Gas by State Note: 2011 data is not restricted to Questar Gas Company rates only but rather is an average of all reporting providers for each state. Funding Detail
Program: Building Operations and Maintenance Function The Public Service Commission is located at the Heber M. Wells Building located at 160 East 300 South in Salt Lake City. Due to lack of space at the Heber Wells Building, employees and services for the Speech and Hearing Impaired Program (Relay Utah), administered by the Public Service Commission, have been moved to the West Regional building, Suite 103 at 168 North 1950 West in Salt Lake City. Both locations are owned and operated by the Department of Administrative Services, Division of Facilities and Construction Management (DFCM). Performance The top three measures identified by the Public Service Commission that indicate success for this program include, 1) Operations, 2) Safety, and 3) Planning. These measures have been identified and tracking them will begin in FY 2014. Operations The goal for operations is to provide a safe and comfortable working environment for both the public and employees. Management and staff are responsible to observe and report potential safety and work related hazards. Safety The goal is to report safety and maintenance issues to the Division of Facilities and Construction Management (DFCM) within 24 hours of discovery. Safety or other potential maintenance/safety issues that are discovered shall be reported to DFCM within one business day. Planning The goal is to have an administrator or his/her designee attend monthly building meetings and risk management training. The Commission Secretary or his/her representative shall attend building meetings that are sponsored by DFCM monthly or whenever such meetings are held. Funding Detail
Program: Energy Independent Evaluator Function Title 54, Chapter 17, the Energy Resource Procurement Act, which governs electric utility solicitations for significant energy resources, requires the Public Service Commission to engage the services of an independent evaluator who reviews and monitors significant PacifiCorp resource procurement activities through a request-for-proposals process to ensure compliance with the terms of statute. The objective of the independent evaluator is to actively monitor the solicitation process for fairness and to render an opinion as to whether the solicitation process is fair, in compliance with Utah state law, and whether any modeling used by PacifiCorp to evaluate bids is sufficient. Performance The key indicators of success for this program are 1) Satisfy statutory obligations, Hire Independent Evaluator (I.E.) and receive required reports timely 2) No State of Utah Supreme Court reversals or statutory responses to court reversals, and 3) Administration of I.E. Program; timely review of work payments with no complaints. Satisfy Statutory Obligations, Hire I.E. and receive required reports timely 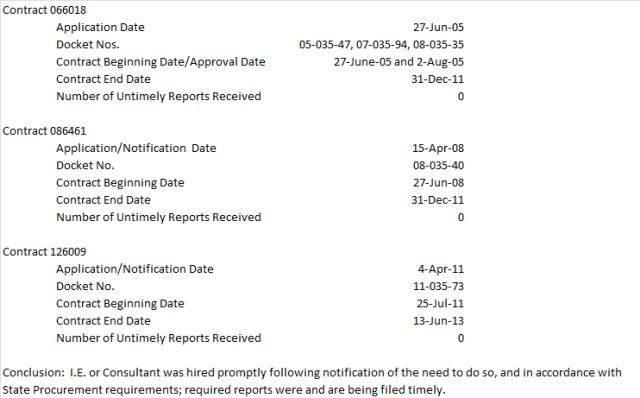 Consistent record, success is determined by no State of Utah Supreme Court reversals or statutory responses to court reversals Conclusion: From 2008 through 2011, no appeals were filed with the Supreme Court related to the hiring of the I.E. nor of the Commission's decisions regarding any of the solicitation processes listed above. Administration of I.E. Program; timely review of work and payments with no complaints. A timely system of work review and payment is established with no complaints. Funding Detail
| ||||||||||||||||||||||||||||||||||||||||||||||||||||||||||||||||||||||||||||||||||||||||||||||||||||||||||||||||||||||||||||||||||||||||||||||||||||||||||||||||||||||||||||||||||||||||||||||||||||||||||||||||||||||||||||||||||||||||||||||||||||||||||||||||||||||||||||||||||||||||||||||||||||||||||||||||||||||||||||||||||||||||||||||||||||||||||||||||||||||||||||||||||||||||||||||||||||||||||||||||||||||||||||||
| <-Previous Page | Next Page-> |
COBI contains unaudited data as presented to the Legislature by state agencies at the time of publication. For audited financial data see the State of Utah's Comprehensive Annual Financial Reports.