Agency: Corrections Function The Department of Corrections is the adult correctional authority for the State of Utah. The department's primary mission is to protect the public. The mission statement of the department reads as follows:
"Our dedicated team of professionals ensures public safety by effectively managing offenders while maintaining close collaboration with partner agencies and the community. Our team is devoted to providing maximum opportunities for offenders to make lasting changes through accountability, treatment, education and positive reinforcement within a safe environment�" The Utah Department of Corrections houses approximately 6,900 inmates in 30 facilities. The majority of inmates are housed at two locations: the Draper and Gunnison prisons. The Division of Institutional Operations manages the inmate population in the secure facilities. In addition, inmates are housed in county jails in 21 of Utah's 29 counties on a contractual basis (see Jail Contracting). In addition to housing state inmates, the department develops and provides programs in order to manage the convicted offender's inappropriate behavior. Programs are designed to prepare and assist offenders in functioning as law-abiding citizens. Once an inmate is released from prison, or if a person is sentenced to probation, they come under the responsibility of Adult Probation and Parole. The Adult Probation and Parole Division operates facilities throughout the state to supervise assigned parolees and probationers as they transition to the community. Statutory Authority The Department of Corrections is governed largely by Section 64 of the Utah Code Annotated. - UCA 64-13-2 creates the Utah Department of Corrections and grants it authority;
- UCA 64-13-6 outlines the department's duties including protecting the public through institutional care and confinement, and supervision of certain offenders within the community.
Performance The information below shows the current prison population count and trend for the past fiscal year. 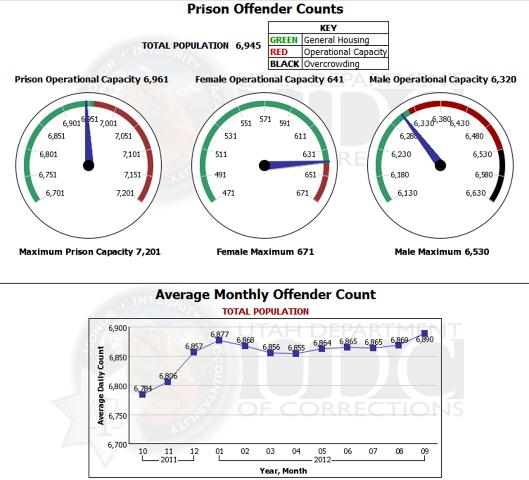 Special Funds  Funding Detail Departmental funding consists primarily of General Fund money with a small percentage of Federal Funds. Dedicated Credits Revenue is mainly generated by Utah Correctional Industries, a for-profit business that teaches inmates new job skills while operating for-profit businesses. Table 1: Operating and Capital Budget Including Expendable Funds and Accounts Sources of Finance
(click linked fund name for more info) | 2009
Actual | 2010
Actual | 2011
Actual | 2012
Actual | 2013
Approp | | General Fund | $244,647,000 | $236,718,900 | $231,557,900 | $237,128,100 | $244,833,000 | | General Fund, One-time | ($1,953,500) | ($14,135,600) | $4,057,500 | ($168,000) | $1,280,000 | | Education Fund | $0 | $0 | $49,000 | $49,000 | $49,000 | | Federal Funds | $726,000 | $1,083,500 | $943,200 | $796,600 | $391,200 | | Dedicated Credits Revenue | $4,328,800 | $4,154,000 | $4,273,700 | $4,527,600 | $4,493,800 | | GFR - DNA Specimen | $515,000 | $515,000 | $515,000 | $0 | $0 | | GFR - Interstate Cmpct for Adult Offender Sup. | $29,000 | $29,000 | $29,000 | $29,000 | $29,000 | | GFR - Prison Telephone Surcharge Account | $0 | $1,500,000 | $1,500,000 | $1,500,000 | $1,500,000 | | GFR - Tobacco Settlement | $81,700 | $81,700 | $0 | $0 | $0 | | Crime Victim Reparations Fund | $750,000 | $0 | $0 | $0 | $0 | | Transfers | $63,900 | $8,600 | $28,800 | $46,400 | $0 | | Transfers - Commission on Criminal and Juvenile Justice | $50,000 | $306,100 | $427,400 | $655,500 | $517,100 | | Transfers - Federal | $0 | $0 | $0 | $1,300 | $0 | | Transfers - Other Agencies | $222,500 | $693,300 | $200,700 | $239,000 | $207,800 | | Beginning Nonlapsing | $9,990,700 | $9,442,600 | $10,244,500 | $19,762,200 | ($750,000) | | Closing Nonlapsing | ($9,676,700) | ($10,244,200) | ($19,762,200) | ($25,208,300) | $0 | | Lapsing Balance | ($244,900) | ($1,107,700) | ($1,684,700) | ($740,100) | $0 | | Total | $249,529,500 | $229,045,200 | $232,379,800 | $238,618,300 | $252,550,900 |
|---|
| | | | | | Line Items
(click linked line item name to drill-down) | 2009
Actual | 2010
Actual | 2011
Actual | 2012
Actual | 2013
Approp |
|---|
| Corrections Programs & Operations | $194,299,800 | $186,300,700 | $183,709,900 | $186,540,900 | $198,943,700 | | Department Medical Services | $23,491,300 | $22,646,600 | $26,894,500 | $27,904,700 | $26,044,400 | | Jail Contracting | $21,219,200 | $20,097,900 | $21,775,400 | $24,172,700 | $27,562,800 | | Jail Reimbursement | $10,519,200 | $0 | $0 | $0 | $0 | | Total | $249,529,500 | $229,045,200 | $232,379,800 | $238,618,300 | $252,550,900 |
|---|
| | | | | | Categories of Expenditure
(mouse-over category name for definition) | 2009
Actual | 2010
Actual | 2011
Actual | 2012
Actual | 2013
Approp |
|---|
| Personnel Services | $170,110,600 | $157,560,900 | $157,601,100 | $160,019,800 | $176,039,500 | | In-state Travel | $102,400 | $30,400 | $31,100 | $46,000 | $34,100 | | Out-of-state Travel | ($11,000) | $9,400 | $21,200 | $18,000 | $7,600 | | Current Expense | $34,223,800 | $33,552,600 | $35,151,100 | $35,394,300 | $37,757,200 | | DP Current Expense | $5,601,300 | $5,875,000 | $6,038,800 | $5,636,100 | $5,422,000 | | DP Capital Outlay | $0 | $46,800 | $133,500 | $5,600 | $0 | | Capital Outlay | $265,700 | $293,800 | $253,200 | $444,800 | $0 | | Other Charges/Pass Thru | $39,428,300 | $31,427,500 | $33,434,800 | $36,983,300 | $33,290,500 | | Cost of Goods Sold | ($191,600) | $248,800 | ($285,000) | $70,400 | $0 | | Total | $249,529,500 | $229,045,200 | $232,379,800 | $238,618,300 | $252,550,900 |
|---|
| | | | | | |
Other Indicators | 2009
Actual | 2010
Actual | 2011
Actual | 2012
Actual | 2013
Approp | | Budgeted FTE | 2,334.0 | 2,310.6 | 2,224.0 | 2,283.6 | 2,296.0 | | Actual FTE | 2,276.0 | 2,117.1 | 2,101.0 | 2,104.9 | 0.0 | | Vehicles | 360 | 362 | 345 | 358 | 361 |
|
|
|
|
|
|
|---|
Subcommittee Table of Contents
Table 4: Business-like Activities Sources of Finance
(click linked fund name for more info) | 2009
Actual | 2010
Actual | 2011
Actual | 2012
Actual | 2013
Approp | | Dedicated Credits Revenue | $21,292,600 | $19,227,000 | $20,368,300 | $22,187,600 | $21,769,600 | | Other Financing Sources | $24,900 | $0 | $0 | $0 | $0 | | Beginning Fund Balance | $6,575,300 | $4,126,600 | $3,755,600 | $3,697,800 | $0 | | Ending Fund Balance | ($4,126,600) | ($3,755,600) | ($3,697,800) | ($4,787,000) | $0 | | Total | $23,766,200 | $19,598,000 | $20,426,100 | $21,098,400 | $21,769,600 |
|---|
| | | | | | Line Items
(click linked line item name to drill-down) | 2009
Actual | 2010
Actual | 2011
Actual | 2012
Actual | 2013
Approp |
|---|
| Utah Correctional Industries | $23,766,200 | $19,598,000 | $20,426,100 | $21,098,400 | $21,769,600 | | Total | $23,766,200 | $19,598,000 | $20,426,100 | $21,098,400 | $21,769,600 |
|---|
| | | | | | Categories of Expenditure
(mouse-over category name for definition) | 2009
Actual | 2010
Actual | 2011
Actual | 2012
Actual | 2013
Approp |
|---|
| Personnel Services | $7,549,600 | $7,060,200 | $6,431,300 | $5,161,000 | $5,923,700 | | In-state Travel | $8,100 | $15,900 | $11,500 | $11,100 | $12,500 | | Out-of-state Travel | $2,800 | $400 | $2,600 | $7,200 | $1,600 | | Current Expense | $13,655,300 | $11,712,400 | $13,244,600 | $15,288,000 | $15,046,000 | | DP Current Expense | $356,500 | $166,400 | $228,900 | $183,900 | $249,200 | | Capital Outlay | $0 | $182,400 | $0 | $0 | $232,300 | | Other Charges/Pass Thru | $0 | $35,900 | $1,400 | $14,100 | $0 | | Cost of Goods Sold | $2,030,900 | $424,400 | $300,600 | $121,200 | $304,300 | | Depreciation | $163,000 | $0 | $205,200 | $311,900 | $0 | | Total | $23,766,200 | $19,598,000 | $20,426,100 | $21,098,400 | $21,769,600 |
|---|
| | | | | | |
Other Indicators | 2009
Actual | 2010
Actual | 2011
Actual | 2012
Actual | 2013
Approp | | Budgeted FTE | 109.0 | 87.0 | 85.3 | 102.2 | 72.0 | | Actual FTE | 93.8 | 87.9 | 78.3 | 73.3 | 0.0 | | Vehicles | 48 | 48 | 47 | 44 | 48 | | Change in Fund Balance | (2,448,700) | (371,300) | (57,800) | 1,098,200 | 0 |
|
|
|
|
|
|
|---|
Subcommittee Table of Contents |