Compendium of Budget Information for the 2013 General Session
| Infrastructure & General Government Appropriations Subcommittee | ||||||||||||||||||||||||||||||||||||||||||||||||||||||||||||||||||||||||||||||||||||||||||
| <-Previous Page | Subcommittee Table of Contents | Next Page-> | ||||||||||||||||||||||||||||||||||||||||||||||||||||||||||||||||||||||||||||||||||||||||||
Line Item: Capital Improvements Function Capital improvement projects are defined as improvement projects on an existing facility costing less than $2,500,000 or new construction projects costing less than $500,000. These projects are sometimes refered to as "Alterations, Repairs and Improvements" (AR&I). Capital improvement funds may not be used for program equipment or routine maintenance. As per UCA 63A-5-104(6) capital improvements must be funded before any new capital development project can be approved. During the 2001 General Session the Legislature increased the minimum improvement funding formula from 0.9 percent to 1.1 percent of the replacement value of all state buildings. As revenue projections went unmet in FY 2002 and FY 2003, the Legislature amended statute to allow for more flexibility. The change allowed the Legislature to fund the program at the original 0.9 percent level during times of budget deficits. Even though funding for capital improvements will increase annually due to inflation and new construction, these funds cannot keep pace with the annual requests for repairs and improvements. Nearly forty percent of Utah's facilities are over twenty-five years old and many have significant problems. One way some maintenance backlogs are eliminated, besides the use of capital improvement funds, is through renovations or replacements of older buildings. The Legislature has used capital development funds to replace aging and worn space that is contributing to the existing maintenance backlog. This helps the state's bond rating, and recognizes the fact that capital improvements alone cannot alleviate the maintenance backlog. In the 2010 General Session the Legislature passed S.B. 189, "Capital Facilities Amendments," which allows the State Building Board to re-allocate bid savings and project residuals for approved capital improvement projects. This change allows funds that otherwise would be deposited in the Project Reserve Fund to be reallocated back to the Capital Improvements line item to be used on other critical improvement projects. Background The following chart shows the 10 year history of capital improvement funding. 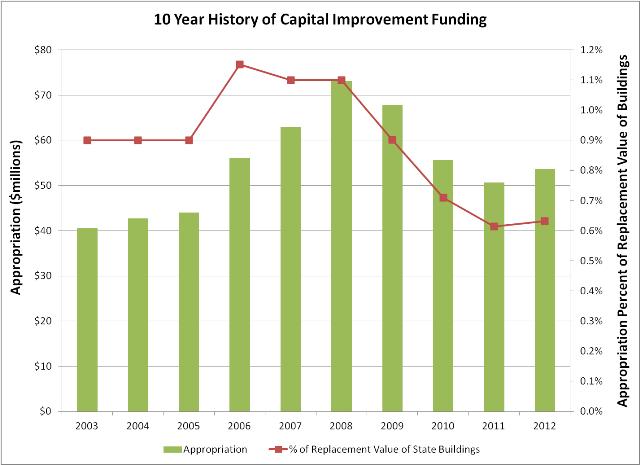 Starting in FY 1995 the Legislature required funding capital improvements at 0.9 percent of the replacement value of state-owned buildings. As mentioned above, the Legislature increased the formula for capital improvement funding to 1.1 percent; but, as a result of economic challenges, did not appropriate the full 1.1 percent level to capital improvements until FY 2006 (when it actually contributed 1.15 percent). In the 2009 thru 2012 General Sessions the Legislature amended the statute to allow a reduction in capital improvement funding below the 0.9 percent level. Funding Detail As construction costs escalated from FY 2005 to 2008, so too did the replacement value of the state's buildings; which led to large funding increases in this line item. However, constrained state revenues in FY 2009 thru 2012 necessitated reductions in funding. In FY 2010 and FY 2012 the Legislature funded a portion of the Capital Improvement budget from the Project Reserve Fund. The Fund had significant balances in those years as a result of favorable construction bids and sizable residuals on major construction projects.
| ||||||||||||||||||||||||||||||||||||||||||||||||||||||||||||||||||||||||||||||||||||||||||
| <-Previous Page | Next Page-> |
COBI contains unaudited data as presented to the Legislature by state agencies at the time of publication. For audited financial data see the State of Utah's Comprehensive Annual Financial Reports.