Compendium of Budget Information for the 2013 General Session
| Business, Economic Development, & Labor Appropriations Subcommittee | |||||||||||||||||||||||||||||||||||||||||||||||||||||||||||||||||||||||||||||||||||||||||||||||||||||||||||||||||||||||||||||||||||||||||||||||||||||||||||||||||||||||||||||||||||||||||||||||||||||||||||||||||||||||||||||||||||||||||||||||||||||||||||||||||||||||||||||||||||||||||||||||||||||||||||||||||||||||||||||||||||||||||||||||||||||||||||||||||||||||||||||||||||||||||||||||||||||||||||||||||||||||||||||||||||||||||||||||||||||||||||||||||||||||||||||||||||||||||||||||||||||||||||||||||||||||||||||||||||||||||||||||||||||||||||||||||||||||||||||||||||||||||||||||||||||||||||||||||||||||||||||||||||||||||||||||||||||||||||||||||||||||||||||||||||||||||||||||||||||||||||||||||||||||||||||||||||||||||||||||||||||||||||||||||||||||||||||||||||||||||||||||||||||||||||||||||||||||||||||||||||||||||||||||||||||||||||||||||||||||||||||||||||||||||||||||||||||||||||||||||||||||||||||||||||||||||||||||||||||||||||||||||||||||||||||||||||||||||||||||||||||||||||||||||||||||||||||||||||||||
| <-Previous Page | Subcommittee Table of Contents | Next Page-> | |||||||||||||||||||||||||||||||||||||||||||||||||||||||||||||||||||||||||||||||||||||||||||||||||||||||||||||||||||||||||||||||||||||||||||||||||||||||||||||||||||||||||||||||||||||||||||||||||||||||||||||||||||||||||||||||||||||||||||||||||||||||||||||||||||||||||||||||||||||||||||||||||||||||||||||||||||||||||||||||||||||||||||||||||||||||||||||||||||||||||||||||||||||||||||||||||||||||||||||||||||||||||||||||||||||||||||||||||||||||||||||||||||||||||||||||||||||||||||||||||||||||||||||||||||||||||||||||||||||||||||||||||||||||||||||||||||||||||||||||||||||||||||||||||||||||||||||||||||||||||||||||||||||||||||||||||||||||||||||||||||||||||||||||||||||||||||||||||||||||||||||||||||||||||||||||||||||||||||||||||||||||||||||||||||||||||||||||||||||||||||||||||||||||||||||||||||||||||||||||||||||||||||||||||||||||||||||||||||||||||||||||||||||||||||||||||||||||||||||||||||||||||||||||||||||||||||||||||||||||||||||||||||||||||||||||||||||||||||||||||||||||||||||||||||||||||||||||||||||||
Function The Labor Commission line item consists of the following programs: Administration; Industrial Accidents; Appeals Board; Adjudication; Workplace Safety; Boiler, Elevator, and Coal Mine Safety; Antidiscrimination, Utah Occupational Safety and Health (UOSH), and Building Operations and Maintenance. Intent Language
Funding Detail For more detail about a particular source of finance or organizational unit, click a linked entry in the left column of the table(s) below.
Function The Administration provides management and oversight for all aspects of the Labor Commission. Centralized accounting, payroll, personnel, customer relations, human resources, legal appeals from the adjudication divison and budgeting are all included in this program. Performance The Labor Commission Administration provides many different services that are difficult to quantify. To measure its performance the administration seeks input from employees through an annual survey to understand if it is supporting employees in their work effectively. The Labor Commission submitted the three questions from this survey it deems as most informative for measuring its performance. They measure Administration's overall performance, whether employees have the physical tools (computers, cars, etc.) they need to do their jobs, and employee satisfaction with working in the Labor Commission respectively. These questions are measured on a Likert Scale where 4=strongly agree, 3=agree, 2=neutral, 1=disagree 0=strongly disagree:
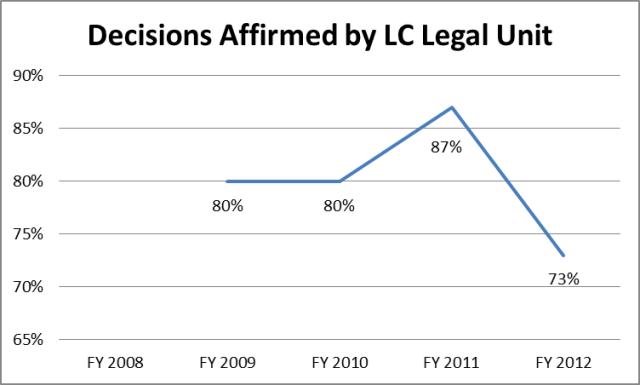
Another important function of Administration centers around its Legal Unit. The Commission's administrative law judges (ALJs) decide any dispute arising from enforcement of Utah's governing laws for workers' compensation, employment and housing discrimination, and workplace safety. When a subject of a dispute wishes to appeal the ALJs decision of their respective case, they can request a review by the Commissioner or the Commission's Appeals Board. The Legal Unit assists the Commissioner and the Appeals Board in reviewing these cases. Since FY 2002, the Legal Unit has averaged about 120 review decisions issued each fiscal year. In FY 2012, the number of review decisions issued by the Legal Unit declined by 1 percent. At 139 decisions issued, FY 2012 numbers exceeded the 10-year average by 16 percent. 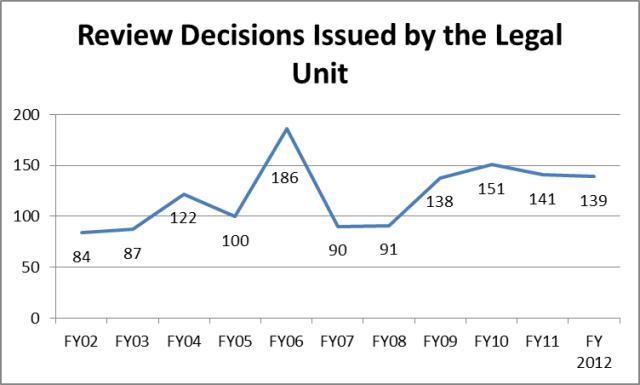 The graph below shows the historical backlog of cases pending review for each fiscal year, which has been markedly reduced from 227 in FY 2008 to a current backlog of 46 cases with the addition of an FTE. 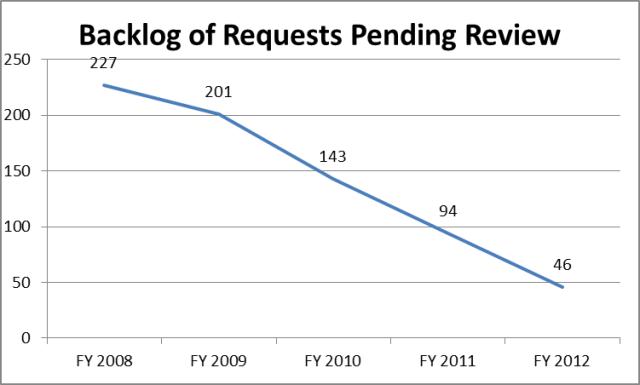 The percentage of legal unit decisions affirmed by the Utah Supreme Court or Utah Court of Appeals demonstrates the quality and accuracy of decisions issued by the Legal Unit. If cases are being overturned at the next level of appeal, it would demonstrate that decisions are not accurate. This is important because the Legal Unit should be making sound and correct legal decisions. Funding Detail
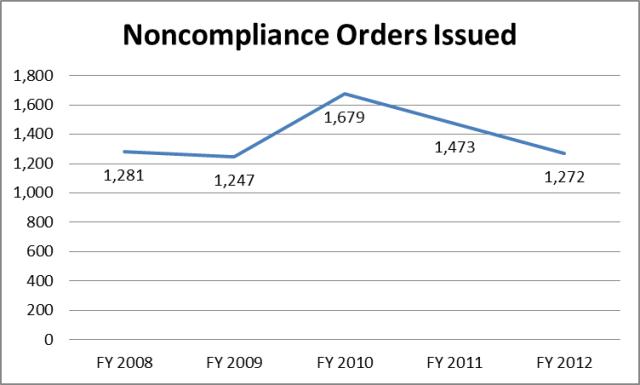
Function The Industrial Accidents Division investigates allegations of noncompliance and, through a series of methods, attempts to bring employers into compliance with State Workers' Compensation laws. It assesses penalties for non-compliance and it monitors injury reporting, injured employee return to work, carrier payment compliance, and informally resolves Workers' Compensation compliance disputes. Performance The Industrial Accidents Division (IAD) monitored workers' compensation coverage for over 79,000 Utah employers in fiscal year 2012, companies are fined for failing to provide statutorily required workers compensation insurance. IAD completed 1,272 investigations in FY 2012.
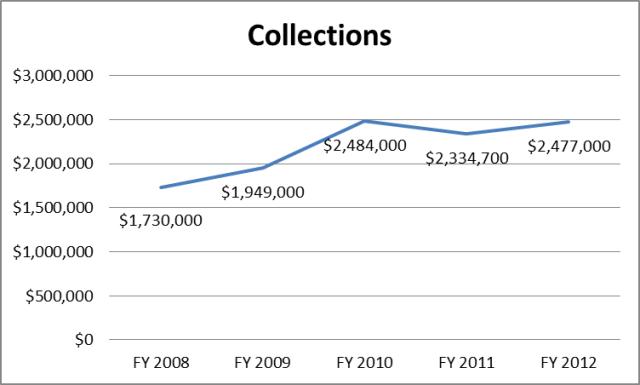
 A second measure shows the level of money assessed and collected on companies that do not provide the state required workers compensation insurance for their employees.
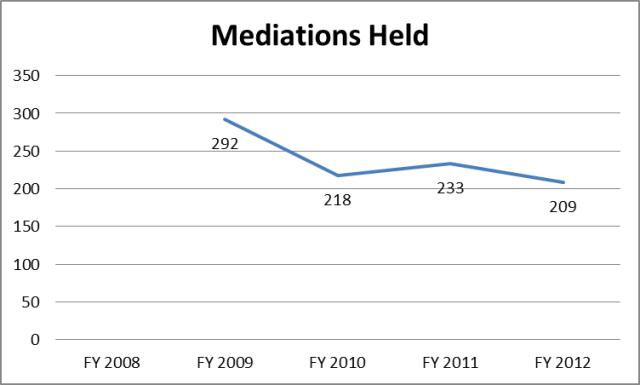
 A third measure IAD uses to determine success is the number of mediations held by the division. One of the objectives of this division is to resolve disputes between injured workers and insurance carriers. Mediation is an expedient cost effective solution which often results in a solution satisfactory to both parties. This eliminates the additional time and expense of having the case move forward to a full adjudicative hearing.
Funding Detail
Function Any party dissatisfied with an administrative law judge's decision can request review by either the Labor Commissioner or an independent Appeals Board. Historically, the appeals board decides approximately 30% of these requests for review. Funding Detail
Function Administrative Law Judges within the Adjudication Division conduct hearings and issue decisions resolving disputes arising from workers' compensation, employment discrimination, housing discrimination, occupational safety and health, and noncompliance matters. Performance The Adjudication division measures success by its timliness in setting hearings and issuing orders from those hearings. Citizens and companies benefit when hearings can have a quick resolution. The public morale is increased when disputes can be settled in a timely manner as well. The goal is to set a hearing within five months from receipt of application. In FY 2012 Adjudication was able to accomplish this 100 percent of the time. It is also the goal of Adjudication to issue orders within 90 days of the hearing. The division was able to accomplish this 99 percent of the time in FY 2012. Another indicator of succes for the Adjudication division is tracked with the percentage of its decisions that are affirmed by the Labor Commission's Legal Unit.
Funding Detail
Program: Boiler, Elevator and Coal Mine Safety Division Function The Division of Boiler, Elevator and Coal Mine Safety is responsible for safety inspections of boilers, pressure vessels and elevators for safe design, installation, and maintenance. The division also administers competency tests to coal miners engaged in certain safety-related coal mine occupations. During the 2008 General Session, the Legislature passed Senate Bill 224, "Coal Mine Safety Act," which created the Office of Coal Mine Safety. Performance One measure the division uses to determine success is the percentage of overdue elevator inspections and investigations in the state. Utah elevators must pass an acceptance inspection at the completion of installation and prior to being placed in service. An elevator must also undergo a periodic (routine) inspection every two years thereafter. An elevator is deemed "overdue for inspection" at 30 days past the expiration date on the inspection certificate. In FY 2012, the Division saw a 10 percent increase in overdue elevator units from FY 2011, taking the total percentage of overdue units to 22 percent; this represents a 37.5 percent increase since FY 2010. Since FY 2004, the average percentage of overdue units is 17 percent. 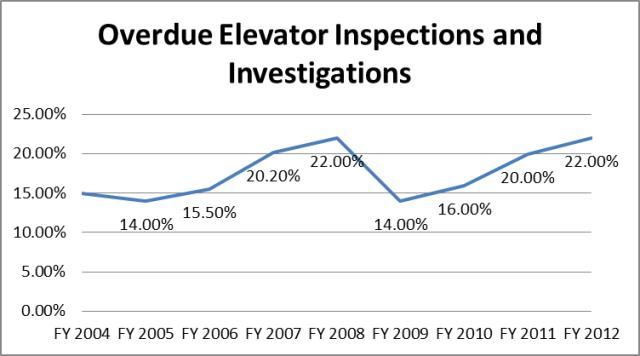 A second measure the division uses is the percentage of successful quality control audits completed. Following each inspection, a quality control audit is completed to ensure that inspections are accurate; if so, the quality control audit is considered successful. In FY 2012, successful quality control audits were completed 100 percent of the time. A third measure the division tracks to monitor efficiency is fee income relative to inspection and certification expenditures. The goal is to keep fee income within 10 percent of expenditures. If fee income is approximately the same as it costs to conduct an inspection, the state's Return on Investment (ROI) reflects that inspections are not being overcharged for, neither undercharged and thereby burdening the state with inspection costs. This measure is important because revenue collected goes to the General Fund. In order to support requests for additional personnel, it is important to understand that fee income will essentially allow the position to pay for itself. The graph below shows historical data for fee income and inspection and certification expenditures; the graph also exhibits the absolute ratio of income to expenditures to show whether the division is meeting its goal of 'income within 10 percent of expenditures'. 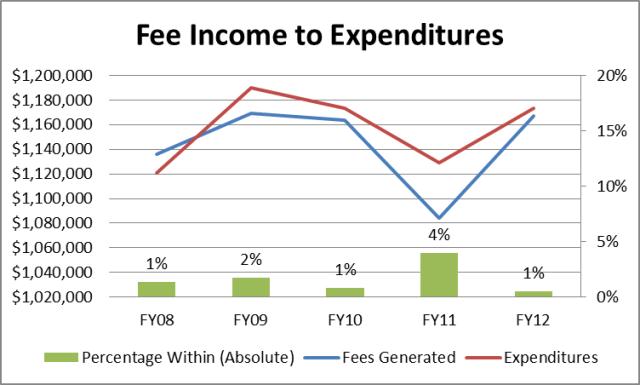 Funding Detail
Function The Workplace Safety program was established in 1996 to provide free safety consultation services and promote workplace safety. Grants are available to local employers to upgrade their safety programs. Funding Detail The Workplace Safety Restricted Account is created and authorized in UCA 34a-2-701. It is the sole source of revenues to the Workplace Safety program. It receives .25 percent of the total workers' compensation premium to the state, as outlined in UCA 59-9-101(2)(c)(ii) .
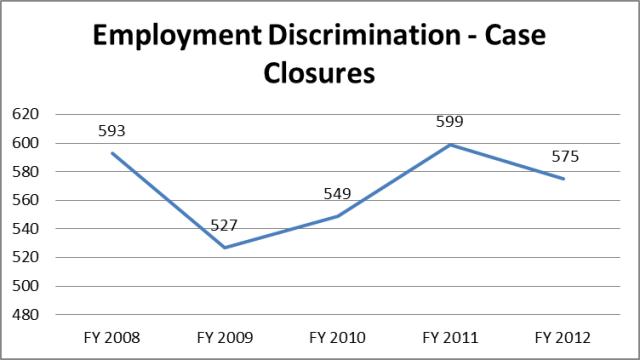
Program: Anti-Discrimination and Labor Function The Utah Antidiscrimination and Labor Division (UALD) enforces equal employment and housing laws, as well as Utah's laws regarding payment of wages, employment of minors and minimum wage. The division has three separate units: The Employment Discrimination Unit investigates, mediates, and resolves claims of employment discrimination; the Fair Housing Unit investigates, mediates and resolves complaints of housing discrimination; and the Wage Claim Unit administers labor laws for wage payment, employment of minors, and minimum wage. The division also has an alternative dispute resolution program that manages a successful mediation program for all three units. Performance One measure the Anti-discrimination and Labor (UALD) uses to determine success is the number of employment discrimination case closures for a fiscal year. UALD has a federal contract that bases funding levels on this measure. An important note when analyzing these numbers is that they are based on a federal fiscal year, rather than a state fiscal year.
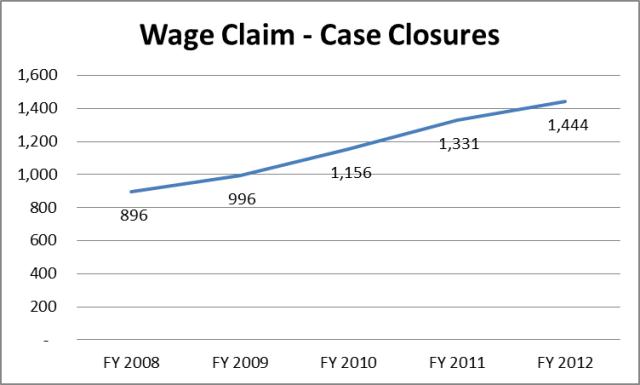
 A second measure UALD uses to determine success is the number of wage claim closures each year. One of the division's goals is to reduce its backlog of cases. To achieve this goal, the division must close more cases than it receives in a given year.
 In conjunction with wage claim case closures per year, UALD has recently begun tracking wage claim cost per case; it represents costs divided by number of cases.
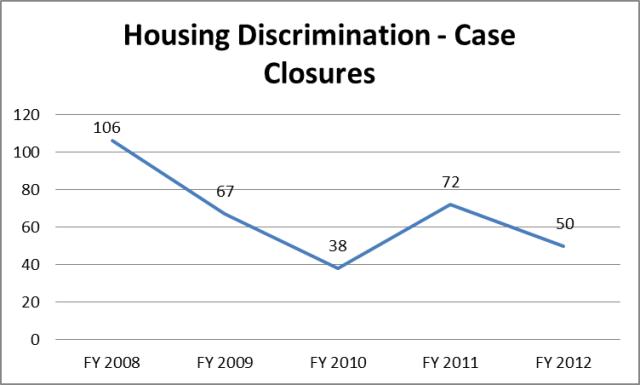
A third measure the division tracks to determine success is housing discrimination case closures per year.
 Funding Detail
Function The Utah OSHA Division ensures employee safety and health in Utah by working with employers and employees to create better working environments. Utah OSHA is focusing on three strategies: 1) strong, fair and effective enforcement; 2) outreach, education and compliance assistance; and 3) partnerships and cooperative programs. Because Utah's Occupational Safety and Health Act is "as effective as" federal OSHA standards, the federal government defers to Utah OSHA for enforcement of occupational safety and health requirements. Federal funds pay a substantial part of the division's operating expenses. Utah OSHA provides free consultation to assist employers in making their operations safe and healthy, and also trains workers and employers to understand safety standards. Utah OSHA also inspects places of employment and, where necessary, requires employers to comply with workplace safety and health standards. Inspectors also check to assure that businesses carry workers' compensation insurance. Additionally, Utah OSHA compiles workplace accident statistics. Intent Language
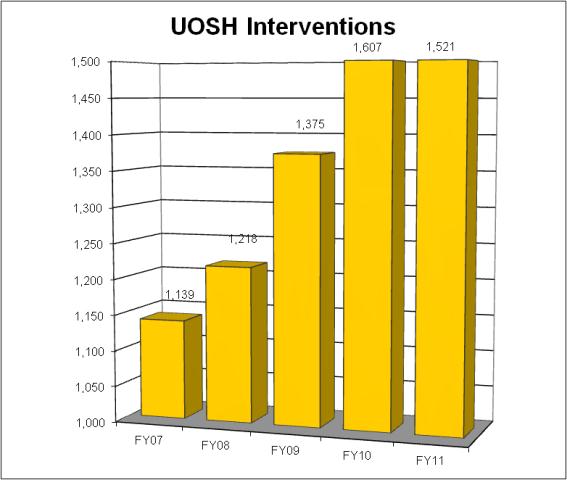
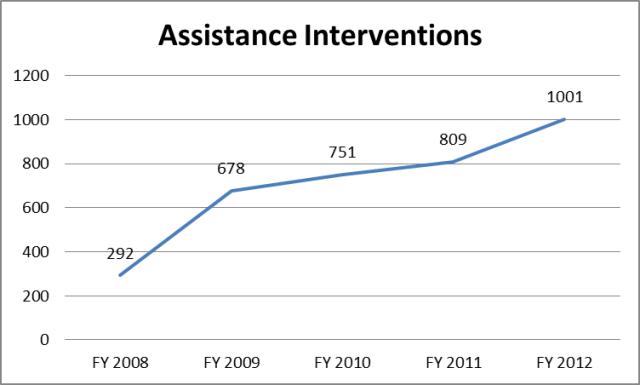
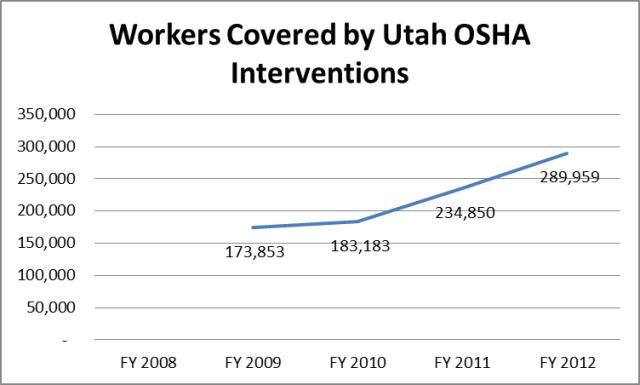
Performance To reflect its effectivness, the division tracks a number of different interventions with employers throughout the fiscal year. Interventions occur when a division employee comes into contact with an employer. The division has highlighted three types of interventions it deems as most representative of its success, they are: Compliance and Consultation, Assistance, and Number of Workers Covered by Utah OSHA. Historical data for each of these intervention types is provided below. In FY 2012 the division increased its total compliance and consultation interventions by about 25 percent from FY 2011. These interventions track how many visits to employer sites are done each year to determine if safety laws are being followed. Another significance of this measure is its accountability for federal grant money.
 This measure tracks how many visits to employer sites are done each year to assist companies who ask for expert help in providing a safe environment for employees. The division also cites this as a key measure for reporting the number of site visits to the federal agency in order to meet contractual obligations.
 With over 1 million employees in the state, the number of workers covered by Utah OSHA measure reflects the number of employees who are impacted by the division's inspections, compared with the work population as a whole, it represents the total number of employees from site visits during the fiscal year.
Funding Detail
Program: Building Operations and Maintenance Function This program shows the amount allocated to pay the office rent. The Labor Commission is primarily located at the Heber M. Wells Building off of 300 South and 200 East in Salt Lake City. The building is owned by the State and operated by the Division of Facilities Construction and Management (DFCM). Funding Detail
| |||||||||||||||||||||||||||||||||||||||||||||||||||||||||||||||||||||||||||||||||||||||||||||||||||||||||||||||||||||||||||||||||||||||||||||||||||||||||||||||||||||||||||||||||||||||||||||||||||||||||||||||||||||||||||||||||||||||||||||||||||||||||||||||||||||||||||||||||||||||||||||||||||||||||||||||||||||||||||||||||||||||||||||||||||||||||||||||||||||||||||||||||||||||||||||||||||||||||||||||||||||||||||||||||||||||||||||||||||||||||||||||||||||||||||||||||||||||||||||||||||||||||||||||||||||||||||||||||||||||||||||||||||||||||||||||||||||||||||||||||||||||||||||||||||||||||||||||||||||||||||||||||||||||||||||||||||||||||||||||||||||||||||||||||||||||||||||||||||||||||||||||||||||||||||||||||||||||||||||||||||||||||||||||||||||||||||||||||||||||||||||||||||||||||||||||||||||||||||||||||||||||||||||||||||||||||||||||||||||||||||||||||||||||||||||||||||||||||||||||||||||||||||||||||||||||||||||||||||||||||||||||||||||||||||||||||||||||||||||||||||||||||||||||||||||||||||||||||||||||
| <-Previous Page | Next Page-> |
COBI contains unaudited data as presented to the Legislature by state agencies at the time of publication. For audited financial data see the State of Utah's Comprehensive Annual Financial Reports.