Agency: Legislature Line Item: Legislative Fiscal Analyst Function The mission of the Office of the Legislative Fiscal Analyst is to "affect good government through objective, accurate, relevant budget advice and documentation." LFA helps legislators balance the budget by projecting revenue, staffing appropriations committees, recommending budgets, and drafting appropriations bills. The office also estimates costs and savings for each piece of legislation via fiscal notes. Finally, it performs studies aimed at improving government efficiency and management. Statutory Authority LFA is created and authorized in Utah Code Annotated 36-12-13. It's functions are further defined in Legislaive Rule. - Joint Rule 3-2-401 outlines LFA's responsibilities as they relate to budgeting.
- Joint Rule 4-2-403 delineates LFA's responsibilities as they relate to fiscal notes.
- Joint Rule 4-2-404 covers performance notes.
Appropriations to the Legislature, including the Legislative Fiscal Analyst, are nonlapsing via 63J-1-602.1. Performance The Legislative Fiscal Analyst measures and reports to the Subcommittee on Oversight factors that directly relate to its stated mission of objectivity, accuracy, and relevance as determined by timeliness. These measures include:
- distribution of feedback among chambers and parties;
- accuracy of initial and final revenue estimates;
- accuracy of initial fiscal notes;
- accuracy of introduced appropriations bills; and
- on-time delivery of fiscal notes.
Measure 1: Distribution of Feedback from Legislators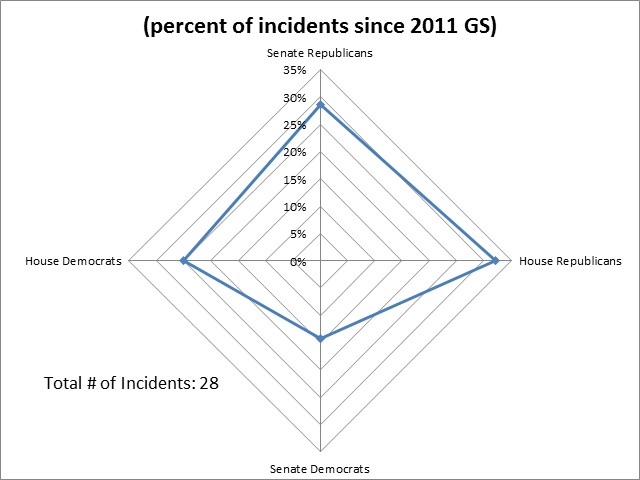 Measure 2: Unrevised Fiscal Notes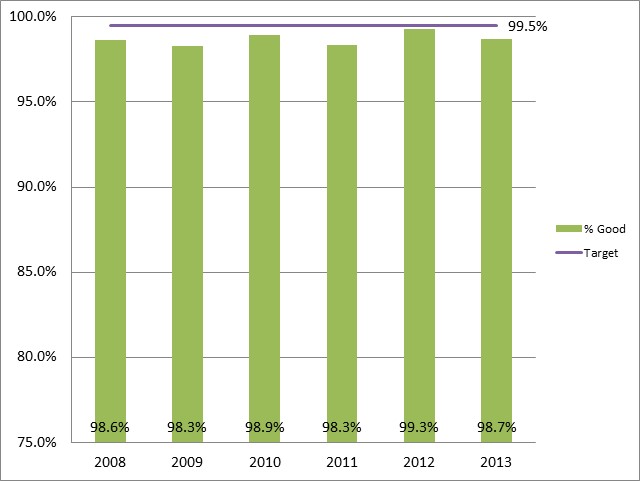 Measure 3: On-target Initial Revenue Estimates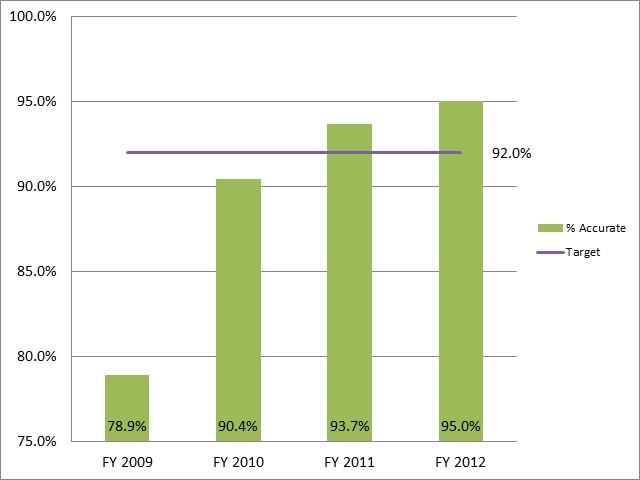 Measure 4: On-target Final Revenue Estimates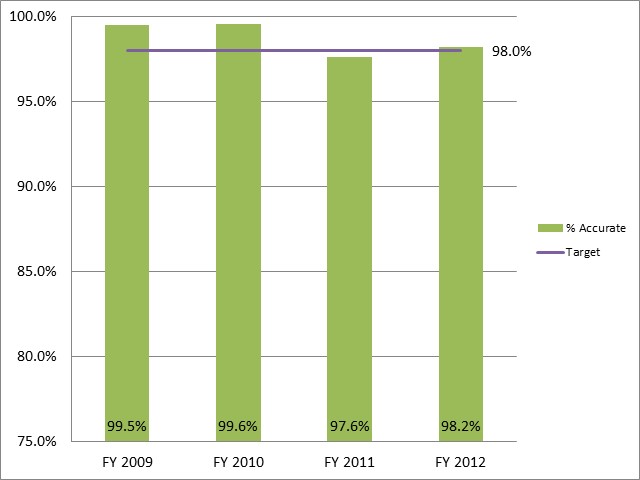 Measure 5: Correctness of Appropriations Bills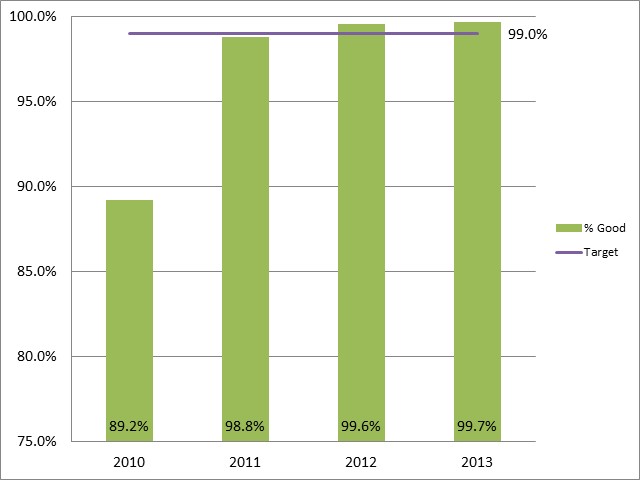 Measure 6: On-time Delivery of Fiscal Notes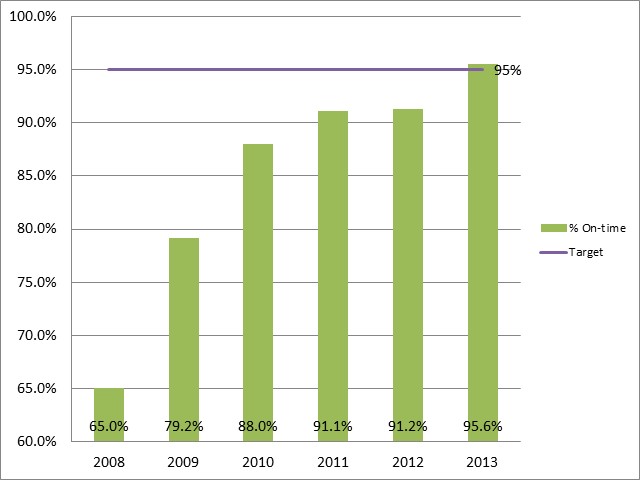 Funding Detail For more detail about a particular source of finance or organizational unit, click a linked entry in the left column of the table(s) below. 2010
Actual | 2011
Actual | 2012
Actual | 2013
Actual | 2014
Approp | 2014
Change | 2014
Revised | 2015
Change | 2015
Approp |
|---|
| $2,382,700 | $2,632,700 | $2,750,000 | $2,639,000 | $2,679,300 | $0 | $2,679,300 | $471,800 | $3,151,100 |
|---|
| ($41,400) | $0 | ($192,700) | $0 | $0 | $3,700 | $3,700 | $3,700 | $7,400 |
|---|
| $0 | $0 | $5,200 | $0 | $0 | $0 | $0 | $0 | $0 |
|---|
| $0 | ($68,100) | $0 | $0 | $0 | ($500,000) | ($500,000) | $500,000 | $0 |
|---|
| $1,463,200 | $1,394,400 | $1,349,200 | $663,700 | $663,700 | $44,400 | $708,100 | $0 | $708,100 |
|---|
| $0 | ($150,000) | ($863,000) | $0 | $0 | $0 | $0 | $0 | $0 |
|---|
| ($1,394,400) | ($1,349,200) | ($663,700) | ($708,100) | ($663,700) | $455,600 | ($208,100) | ($500,000) | ($708,100) |
|---|
$2,410,100 | $2,459,800 | $2,385,000 | $2,594,600 | $2,679,300 | $3,700 | $2,683,000 | $475,500 | $3,158,500 |
|---|
Programs:
(click linked program name to drill-down) |
|---|
| Administration and Research | | Total |
|---|
2010
Actual | 2011
Actual | 2012
Actual | 2013
Actual | 2014
Approp | 2014
Change | 2014
Revised | 2015
Change | 2015
Approp |
|---|
| $2,410,100 | $2,459,800 | $2,385,000 | $2,594,600 | $2,679,300 | $3,700 | $2,683,000 | $475,500 | $3,158,500 |
|---|
$2,410,100 | $2,459,800 | $2,385,000 | $2,594,600 | $2,679,300 | $3,700 | $2,683,000 | $475,500 | $3,158,500 |
|---|
2010
Actual | 2011
Actual | 2012
Actual | 2013
Actual | 2014
Approp | 2014
Change | 2014
Revised | 2015
Change | 2015
Approp |
|---|
| $2,254,600 | $2,223,300 | $2,249,700 | $2,328,000 | $2,436,500 | ($37,800) | $2,398,700 | $472,300 | $2,871,000 |
|---|
| $3,300 | $2,200 | $2,100 | $3,600 | $3,000 | $1,000 | $4,000 | $0 | $4,000 |
|---|
| $12,100 | $10,400 | $9,400 | $12,900 | $10,000 | $3,000 | $13,000 | $0 | $13,000 |
|---|
| $95,200 | $159,500 | $97,200 | $94,800 | $165,900 | ($43,600) | $122,300 | $2,200 | $124,500 |
|---|
| $38,900 | $64,400 | $26,600 | $58,200 | $63,900 | $1,100 | $65,000 | $1,000 | $66,000 |
|---|
| $6,000 | $0 | $0 | $78,300 | $0 | $80,000 | $80,000 | $0 | $80,000 |
|---|
| $0 | $0 | $0 | $18,800 | $0 | $0 | $0 | $0 | $0 |
|---|
$2,410,100 | $2,459,800 | $2,385,000 | $2,594,600 | $2,679,300 | $3,700 | $2,683,000 | $475,500 | $3,158,500 |
|---|
Other Indicators
|
|---|
| Budgeted FTE | | Actual FTE |
|
|---|
2010
Actual | 2011
Actual | 2012
Actual | 2013
Actual | 2014
Approp | 2014
Change | 2014
Revised | 2015
Change | 2015
Approp |
|---|
| 21.0 | 21.0 | 19.0 | 20.0 | 20.0 | 0.0 | 20.0 | 3.0 | 23.0 |
|---|
| 19.5 | 18.2 | 19.1 | 19.4 | 0.0 | 0.0 | 0.0 | 0.0 | 0.0 |
|---|
|
|
|
|
|
|
|
|
|
|---|
|
 (PDF)
(PDF) Previous Page | Committee Table of Contents | Next Page