Compendium of Budget Information for the 2014 General Session
Executive Appropriations Committee  (PDF) (PDF) | ||||||||||||||||||||||||||||||||||||||||||||||||||||||||||||||||||||||||||||||||||||||||||||||||||||||||||||||||||||||||||||||||||||||||||||||||||||||||||||||||||||||||||||||||||||||||||||||||||||||||||||||||||||||||||||||||||||||||||||||||
 Previous Page | Committee Table of Contents | Next Page Previous Page | Committee Table of Contents | Next Page | ||||||||||||||||||||||||||||||||||||||||||||||||||||||||||||||||||||||||||||||||||||||||||||||||||||||||||||||||||||||||||||||||||||||||||||||||||||||||||||||||||||||||||||||||||||||||||||||||||||||||||||||||||||||||||||||||||||||||||||||||
Line Item: Legislative Auditor General Function It is the mission of the Office of the Legislative Auditor General to serve the citizens of Utah by providing objective information, in-depth analyses, and useful recommendations that help legislators and other decision makers:
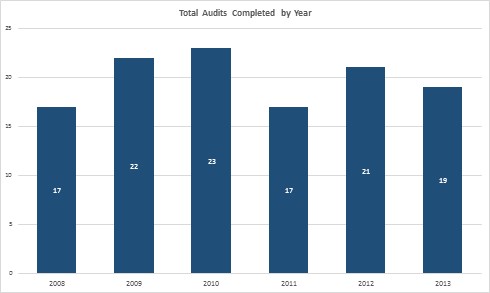
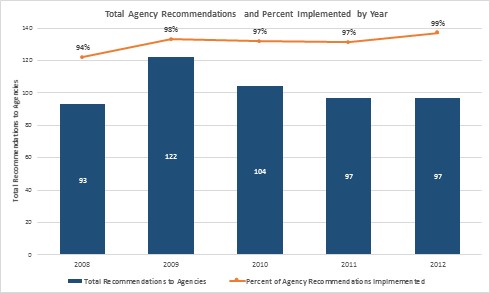
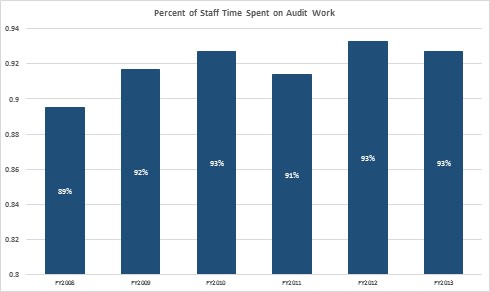
To achieve this mission, the office completes in-depth audits and special projects requested by the Legislature. Statutory Authority Article VI, Section 33 of the Utah Constitution creates the Legislative Auditor General. The Office of the Legislative Auditor General is further defined in UCA 36-12-15. Appropriations to the Legislature, including the Legislative Fiscal Analyst, are nonlapsing via 63J-1-602.1. Performance The Legislative Auditor General reports the following performance measures: Measure 1: Audits Completeds  Measure 2: Recommendations Implemented  Measure 1: Staff Efficiency  Funding Detail For more detail about a particular source of finance or organizational unit, click a linked entry in the left column of the table(s) below.
| ||||||||||||||||||||||||||||||||||||||||||||||||||||||||||||||||||||||||||||||||||||||||||||||||||||||||||||||||||||||||||||||||||||||||||||||||||||||||||||||||||||||||||||||||||||||||||||||||||||||||||||||||||||||||||||||||||||||||||||||||
 Previous Page | Next Page Previous Page | Next Page |
COBI contains unaudited data as presented to the Legislature by state agencies at the time of publication. For audited financial data see the State of Utah's Comprehensive Annual Financial Reports.