Fiscal Highlights - May 2016
|
Behind the Trends in State Expenditures -
Clare Tobin Lence ( Each month, LFA staff update the Expenditures section of the Fiscal Health Dashboard to help legislators, staff, and others monitor spending by state agencies through the fiscal year. This section of the dashboard includes five key areas: Medicaid, Higher Education, Public Education, Criminal Justice, and Transportation. Dashboard expenditure indicators show a year-to-date amount for recorded spending within the fiscal year -- currently as of day 311. The historical data chart (seen by clicking the "Show History" button) provides some additional detail on trends over time. The red line on the chart shows total Actual (for previous years) and Revised Estimated (for the current year) expenditures. Four of the areas -- all except Transportation -- anticipate increased expenditures in FY 2016 as compared to FY 2015. In each of these cases, the red line shows a greater increase in FY 2016 than the trend would suggest due to new appropriations from the 2015 General Session, when there were significant resources available. However, most of these areas are not spending as quickly as would be expected given previous year-to-date expenditures and accounting for the new appropriations. The blue bars on the historical data chart show year-to-date spending in each area. The slower spending can be seen on this chart and also on the gauge. If the gauge needle is straight up and down, spending is exactly on track with the previous year's year-to-date spending, factoring in any increase in appropriations. A needle in the green range indicates slower-than-expected spending; a needle in the red range indicates faster-than-expected spending. Slower-than-expected spending at day 311 could lead to two possible results by the close of the fiscal year. First, spending could increase in the final months and meet the Revised Estimated total. Second, year-end expenditures could be lower than the Revised Estimated amount, leaving a lapsing or nonlapsing balance. If expenditures close out lower than expected, the red line data point for FY 2016 Actual will be lower than it was for FY 2016 Revised Estimated, pulling down the trend line. Cautious spending (to avoid overspending), new program implementation, or a need for a supplemental adjustment in the next General Session could all slow spending in a way that may or may not lead to a full catch-up by the close of the fiscal year. In the case that balances result, there are a few potential causes. One is the challenge for agencies to estimate their nonlapsing balances in October, very early in the fiscal year. Agencies may also underestimate nonlapsing balances to avoid having them reallocated during the General Session. Lapsing balances may result from non-state funds, if agencies ultimately collect fewer federal funds, dedicated credits, or restricted funds than what was appropriated. Lastly, changes in accounting policies may influence trend lines. Each of the areas shown in the Expenditures section illustrates a different example of possible year-end scenarios. A full discussion of the factors driving the trends in these areas will be presented at the June meeting of the Executive Appropriations Committee. 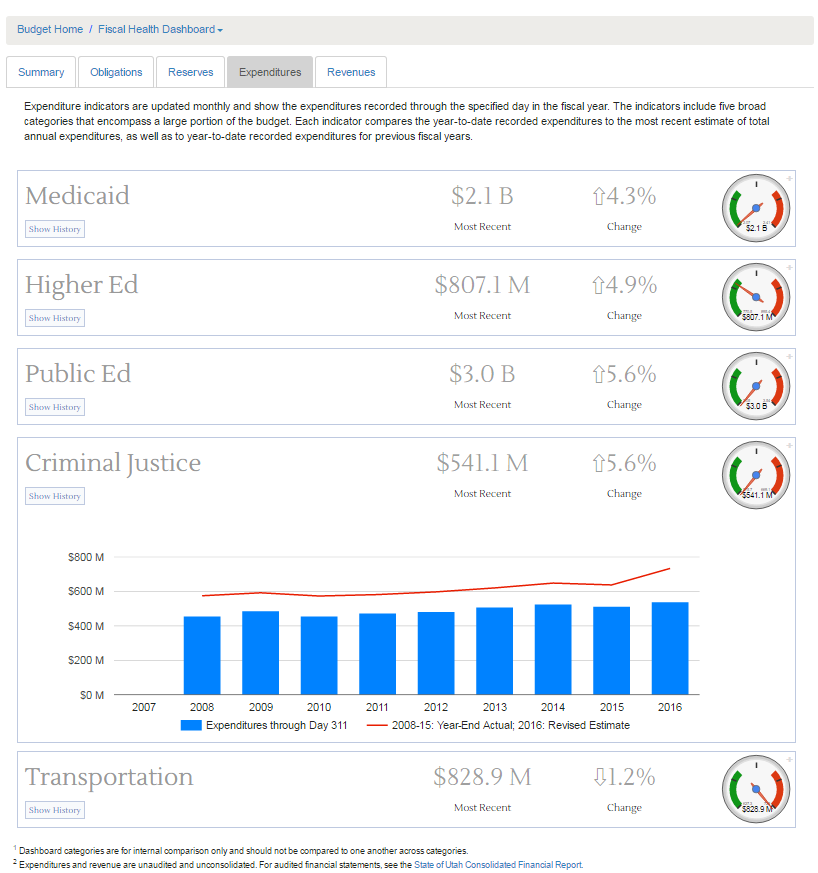 Figure 1. Dashboard Expenditures as of Day 311, FY 2016, with Criminal Justice detail. |
2016 Second Special Session Public Education Appropriations - Jill L.Curry Following the 2016 General Session, Governor Herbert vetoed Item 6 in Senate Bill (S.B.) 2, Public ...Behind the Trends in State Expenditures - Clare Tobin Lence Each month, LFA staff update the Expenditures section of the Fiscal Health Dashboard to help legi...Budget of the State of Utah - 2016 General Session - Ben Leishman Each year, the Fiscal Analyst's office produces an appropriations report. This year's report is a...Budget Policy Changes Enacted in 2016 G.S. - Steven M. Allred During the 2016 General Session, the Legislature passed several bills that had an impact on budgeta...Dredging the Great Salt Lake and Utah Lake - Ivan D. Djambov The low water levels at the Great Salt Lake and Utah Lake motivated the 2015 Legislature to appropr...Higher Education Tuition Increases for 2016-17 - Spencer C. Pratt During its regular meeting on April 1, 2016, the State Board of Regents approved a first-tier tui...Legislature funds $57 million of new requests with TANF - Stephen C. Jardine The Department of Workforce Services (DWS) administers the federal Temporary Assistance for Needy F...Medicaid Used 25% of Available General Fund in FY 2015 - Russell T. Frandsen Five State government entities (Departments of Health, Human Services, and Workforce Services as we...New Buildings for FY 2017 - Angela J. Oh During the 2016 General Session, the Legislature appropriated funding for 10 state-funded capital d...Office of Administrative Rules - Brian Wikle The 2016 Legislature passed and the Governor signed H.B. 103, "Department of Administrative Service...Tourism and "The Mighty Five" - Andrea Wilko Utah's travel and tourism industry is extremely diverse including natural, cultural, and historic...Utah Communications Authority Process/Internal Controls Recommendations - Gary R. Syphus On Tuesday May 17th, the Legislative Fiscal Analyst (LFA) briefed the Executive Appropr...UtahFutures Adds a Couple New Features while Operating on One-Time Funding - Thomas E. Young On May 12th, UtahFutures released two new features to their website, utahfutures.org. The new featu... |
Reports/Archive | Budget Process | Office Background | Who's Who | Organization Chart
Office of the Legislative
Fiscal Analyst
House Building, Suite W310
Salt Lake City, UT 84114
Phone (801) 538-1034 Fax (801) 538-1692