Fiscal Highlights 2014
|
The Changing Demographics of Expected Income -
Angela J. Oh ( The two recent recessions and subsequent recoveries continue to affect expected lifetime income by age groups differently, particularly the younger generation. This can be seen in the early 2000s, when the technology bubble burst, and when the housing market collapsed a few years later. As a result of the technology bubble burst, the median income of the older generation (55 years of age and older) was higher than the other age groups, while the younger generation's (15-34 age group) was the lowest. By 2005, the older generation group saw their median income increase by over 1.5% since 2000; they were the only group with gains over the four years following the technology bubble. The younger generation (15-34 age group), on the other hand, saw their median household income drop by about 8% through 2004. They saw a small rebound, with their median household income appreciate by 0.5% in 2005. 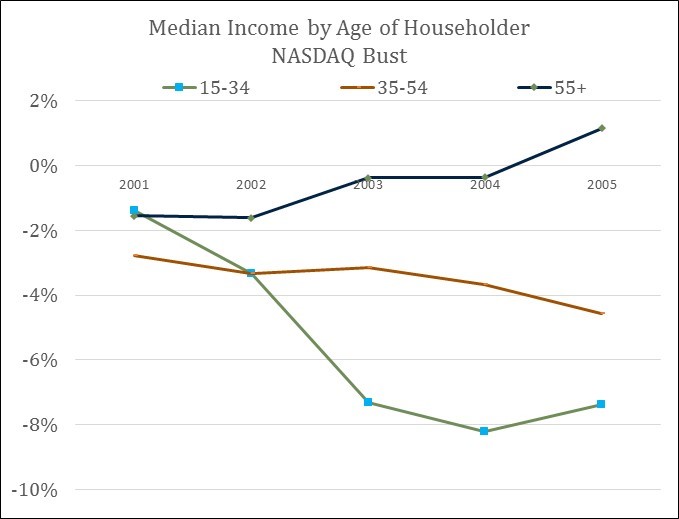 A similar trend can be seen for the recent housing bust recovery (see figure below). In 2008, the median income of the older generation (55 years of age and older) was positive by 2012, at about 2%. Over the same time period, the younger generation's (15-34 age group) median household income was about 11% lower than it was in 2008. The younger generation's income drop bottomed in 2010 at close to 15% below where it was before the housing market deteriorated. 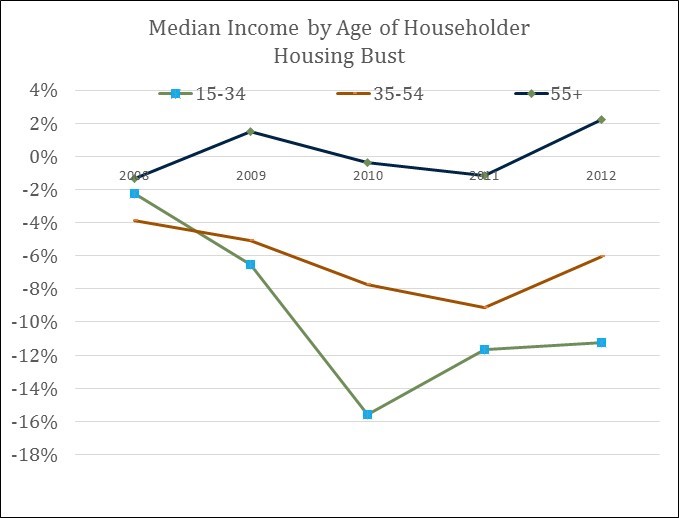 The past decade's experience for the younger working age population is something that will likely last with them throughout their life, with lower overall expected income through their entire working career. Not only have these individuals been hit harder, but the effects are lasting longer. Due to this, younger generations have a higher likelihood of renting instead of owning their home, living with their parents, marrying later, waiting to have children and having fewer children, staying in school longer, and decreasing consumer spending, etc. |
Coyote Removal Program - Ivan D. Djambov The Division of Wildlife Resources (DWR) has been working to improve the mule deer numbers in Utah ...DAS and DTS Reports - Gary K. Ricks In the last few months, the Departments Technology Services and Administrative Services and ha...How Close Did We Come to the Cap on Sales Tax Earmarks for Transportation in FY 2014? - Steven M. Allred Since 2005, the Legislature has earmarked portions of the sales tax for highway construction projec...How Have Tax Changes in Utah Compared to the Nation? - Thomas E. Young Every spring and winter, the National Association of State Budget Officers (NASBO) releases numbers...Income Tax Appropriations to Public and Higher Education - Ben Leishman In November 1996, Utah voters amended the Utah Constitution to formally authorize the pra...Pew Final Key Findings - Gary R. Syphus After several months of research, the Pew Charitable Trusts' Public Safety Performance Project ...Snow College Concurrent Enrollment Update - Spencer C. Pratt During the 2014 General Session, the Legislature passed S.B. 38, "Snow College C...The Changing Demographics of Expected Income - Angela J. Oh The two recent recessions and subsequent recoveries continue to affect expected lifetime income by ...Utah's Credit Rating and Debt Measures - Brian Wikle Did you know the State of Utah has a credit score? Although the stat...Utah's Revenue Continues to Grow - Andrea Wilko Utah ended FY 2014 with a $166 million General and Education Fund revenue surplus. The revenu... |
Reports/Archive | Budget Process | Office Background | Who's Who | Organization Chart
Office of the Legislative
Fiscal Analyst
House Building, Suite W310
Salt Lake City, UT 84114
Phone (801) 538-1034 Fax (801) 538-1692